
Node.js API monitoring: what to measure, how to set it up, and which tools fit a small team
The metrics that catch real incidents, a dependency-free middleware you can run today, and how the tools compare.
Node.js API monitoring means recording, for every route your API serves, how often it is called, how often it fails and how long it takes, plus the state of the process serving it (event loop delay, memory, connection pools) and the slow or failing calls it makes to databases and other APIs. For a small team it comes down to four layers: availability (is it up), request-level traffic (who called what, and what came back), performance inside the request (APM: where the time went) and security signals (who is probing or abusing it). Uptime checks cover the first layer. Most incidents a customer reports live in the other three.
This guide covers what to measure and how to set targets, a monitoring middleware you can run today with no dependencies, how OpenTelemetry fits, a fair comparison of the tools small teams pick, and which alerts are worth waking up for. Code was tested on Node.js 22.23 and 24.22 with Express 5.3.0 and @opentelemetry/auto-instrumentations-node 0.83.1.
The four layers of Node.js API monitoring
| Layer | Question it answers | Typical source |
|---|---|---|
| Availability | Can anyone reach the API at all? | External uptime checks against a health endpoint |
| Request-level traffic | Which routes, which customers, which status codes, what was sent and returned? | Middleware, a request log, an API gateway |
| Performance inside the request (APM) | Which query, cache call or outbound request made this request slow? | Tracing: OpenTelemetry or an APM agent |
| Security signals | Who is probing, scraping or brute-forcing the API? | Request log analysis, a WAF, rate limiter counters |
Most teams start with the first layer because it’s free and takes five minutes. It’s also the layer least likely to catch the problem. A health check that returns 200 tells you the process is alive and the route that serves /health is fast. It says nothing about /checkout.
What to measure, with targets
Rate, errors and duration per route
The RED method, as Tom Wilkie lays it out on the Grafana Labs blog, is the standard starting point for request-driven services: for every endpoint, track request rate, error rate and duration. Three rules make those numbers useful in a Node API.
Group by route pattern, never by URL. /orders/123 and /orders/124 are the same endpoint. If you label metrics by raw URL you get one series per order ID, your metrics backend fills up, and no single series has enough data to mean anything. Use the pattern your router matched (/orders/:id).
Split errors by class. A rise in 5xx is your bug or your dependency’s outage. A rise in 4xx is usually a client problem, a bad deploy of a client, or someone testing passwords against /login. Both matter, for different reasons, so keep them as separate numbers. The 401 vs 403 split is worth tracking on its own if you serve authenticated traffic.
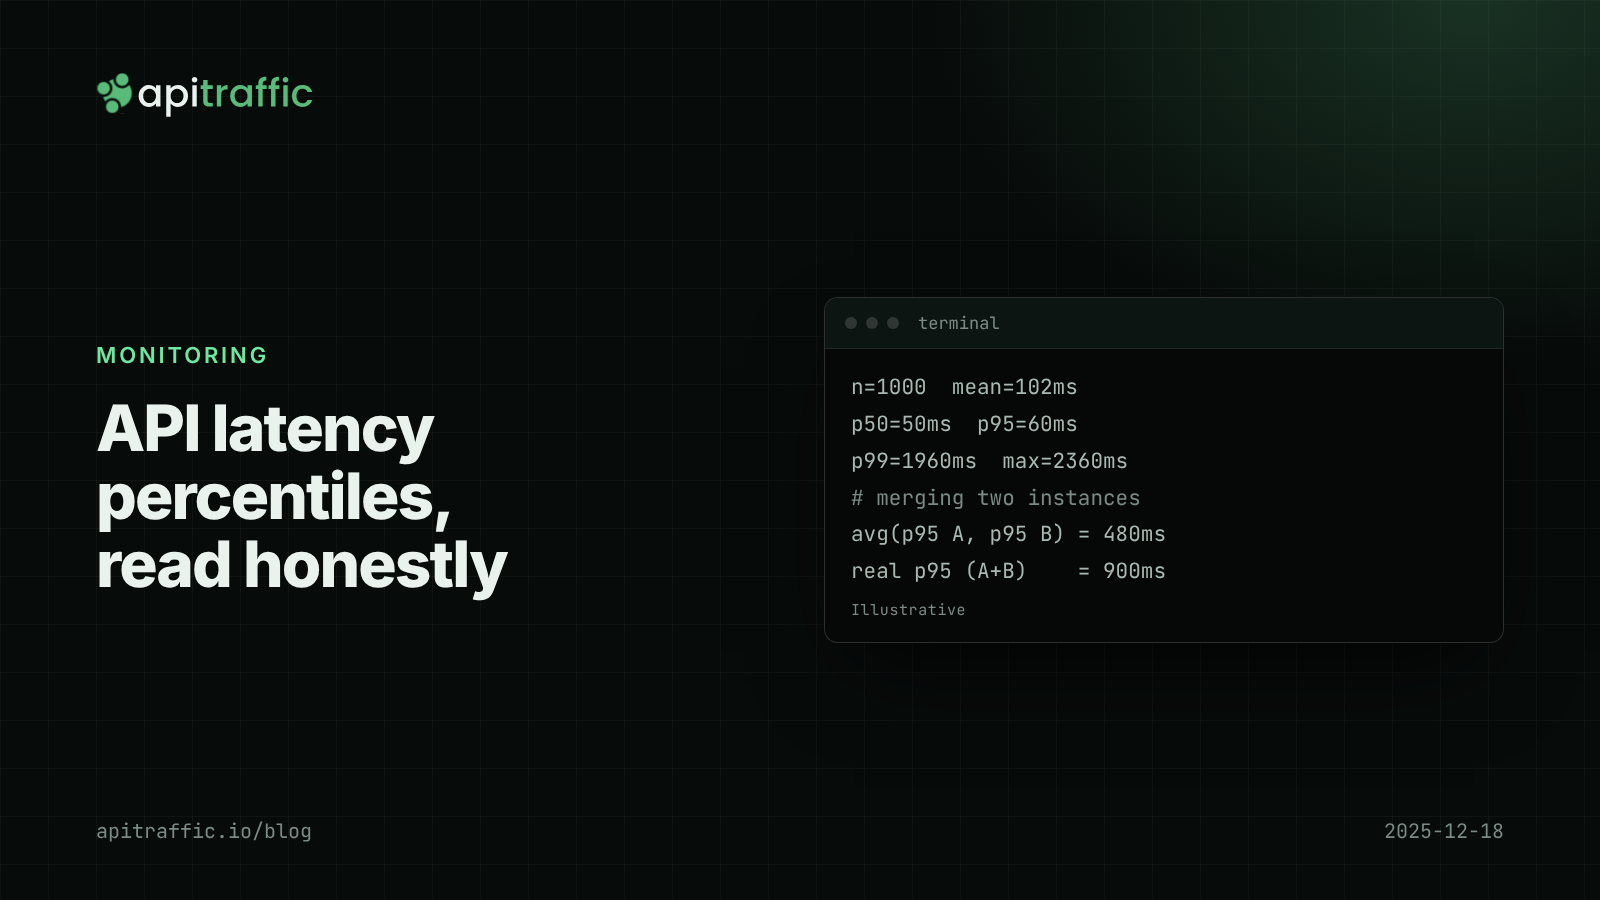
Track duration as percentiles. An average hides the slow requests that customers complain about. Watch p50 for the typical request, p95 for what one in twenty users sees and p99 for the tail that usually comes from queueing, retries or a cold dependency. Our guide to API latency percentiles covers how to compute them correctly (you can’t average percentiles across servers) and how to pick targets.
Targets depend on what the endpoint does, so set them from your own traffic. Measure each route’s p95 and 5xx rate over a normal week, set the target a little better than that baseline, and tighten it as you fix things. Search and export endpoints get their own, looser targets. An error budget turns them into a decision rule for when to stop shipping features and fix reliability.
Saturation: the Node process itself
RED tells you a route got slow. Saturation metrics tell you why every route got slow at once.
- Event loop delay: Node runs your JavaScript on one thread. If one handler does 120 ms of synchronous work (a big
JSON.parse, a regex on user input, a sync crypto call), every other request waits behind it.perf_hooks.monitorEventLoopDelay()measures this directly. Our post on event loop lag covers how to find the code that causes it. - Heap used: steady growth across hours with no traffic growth is a leak. See finding a Node.js memory leak with heap snapshots.
- Connection pool usage: when every database connection is checked out, new queries wait for one, and the wait shows up as latency on routes that look fine in isolation. Pool starvation is one of the most common causes of a p99 spike that no single query explains.
- libuv threadpool: file system calls, DNS lookups and some crypto run on a pool of four threads by default. If they queue, unrelated requests slow down. See UV_THREADPOOL_SIZE.
Outbound dependencies
A large share of slow and failing requests start one hop away: a payment provider, an email API, an LLM endpoint. Record the latency and status of every outbound call, grouped by host. When a provider’s p95 doubles, you want to see it on a chart before your own p95 doubles. The posts on third-party API latency and logging outbound HTTP requests go deeper, and fetch timeouts keep a slow dependency from holding your requests open.
Status-code mix
Plot the count of each status class per minute on one chart. It is the fastest way to see a deploy go wrong (5xx jumps), a client break (400s jump), an auth change misfire (401s jump) or a scraper arrive (404s on paths you never served). Deploy markers on the same chart tell you whether the change lines up with a release.
Why uptime checks and logs alone miss it
Here is an illustrative failure, assembled from a pattern that’s common in small B2B APIs.
One customer’s integration starts getting 504 Gateway Timeout on POST /v1/exports. Their exports cover two years of data; everyone else exports a month. The export handler runs a query that is fast for small accounts and takes 70 seconds for this one, so the load balancer gives up at 60 seconds and returns 504.
What each tool shows:
- Uptime check: green.
/healthanswers in 8 ms. - Host logs: a line per request with the status your app sent. The 504 came from the load balancer, so your app’s log shows nothing, or a
200written 70 seconds later to a socket nobody was reading. - Error tracker: nothing. No exception was thrown.
- Average latency chart: flat. One customer’s requests are a rounding error in the mean.
What finds it: p99 for POST /v1/exports (it jumps), requests filtered by customer ID (all of the slow ones belong to one account), and a trace of one slow request (one query is 69 of the 70 seconds). Those are the request-level and APM layers. Our post on Node.js server timeouts covers the load balancer side of this.
Instrumenting a Node.js API by hand
You can get RED metrics and event loop delay with no dependencies. The middleware below works on Express 4 and 5; the same idea ports to Fastify hooks or Koa middleware.
// red.js: rate, errors and duration per route pattern, plus event loop delay
const { monitorEventLoopDelay } = require('node:perf_hooks');

const BUCKETS_MS = [5, 10, 25, 50, 100, 250, 500, 1000, 2500, 5000, Infinity];
const routes = new Map();

function statsFor(key) {
  if (!routes.has(key)) {
    routes.set(key, { count: 0, e5xx: 0, e4xx: 0, buckets: BUCKETS_MS.map(() => 0) });
  }
  return routes.get(key);
}

function redMetrics() {
  return (req, res, next) => {
    const start = process.hrtime.bigint();
    res.on('finish', () => {
      const ms = Number(process.hrtime.bigint() - start) / 1e6;
      // Group by route pattern, not URL, or every /orders/123 becomes its own series
      const pattern = req.route ? req.baseUrl + req.route.path : 'unmatched';
      const s = statsFor(`${req.method} ${pattern}`);
      s.count++;
      if (res.statusCode >= 500) s.e5xx++;
      else if (res.statusCode >= 400) s.e4xx++;
      s.buckets[BUCKETS_MS.findIndex((b) => ms <= b)]++;
    });
    next();
  };
}

// Upper bound of the bucket that holds the p-th request
function percentile(s, p) {
  let seen = 0;
  for (let i = 0; i < BUCKETS_MS.length; i++) {
    seen += s.buckets[i];
    if (seen >= Math.ceil(s.count * p)) return BUCKETS_MS[i];
  }
}

const loop = monitorEventLoopDelay({ resolution: 20 });
loop.enable();
const ms = (ns) => Math.round(ns / 1e5) / 10;

function snapshot() {
  const out = {
    eventLoopDelayMs: { p50: ms(loop.percentile(50)), p99: ms(loop.percentile(99)), max: ms(loop.max) },
    heapUsedMb: Math.round(process.memoryUsage().heapUsed / 1048576),
    routes: {},
  };
  for (const [key, s] of routes) {
    out.routes[key] = {
      requests: s.count,
      rate5xx: +(s.e5xx / s.count).toFixed(3),
      rate4xx: +(s.e4xx / s.count).toFixed(3),
      p50Ms: percentile(s, 0.5),
      p95Ms: percentile(s, 0.95),
      p99Ms: percentile(s, 0.99),
    };
  }
  loop.reset();
  routes.clear(); // each snapshot covers the time since the previous one
  return out;
}

module.exports = { redMetrics, snapshot };
Wire it into an app with one normal route and one route that blocks the event loop for 120 ms:
// server.js
const express = require('express');
const { redMetrics, snapshot } = require('./red');

const app = express();
app.use(redMetrics());

app.get('/orders/:id', async (req, res) => {
  await new Promise((r) => setTimeout(r, 20 + Math.random() * 60));
  if (req.params.id === '13') return res.status(500).json({ error: 'db_timeout' });
  res.json({ id: req.params.id });
});

app.get('/report', (req, res) => {
  const end = Date.now() + 120; // blocks the event loop for 120 ms
  while (Date.now() < end);
  res.json({ ok: true });
});

// Keep this behind auth or on an internal port in production
app.get('/internal/metrics', (req, res) => res.json(snapshot()));

app.listen(3000);
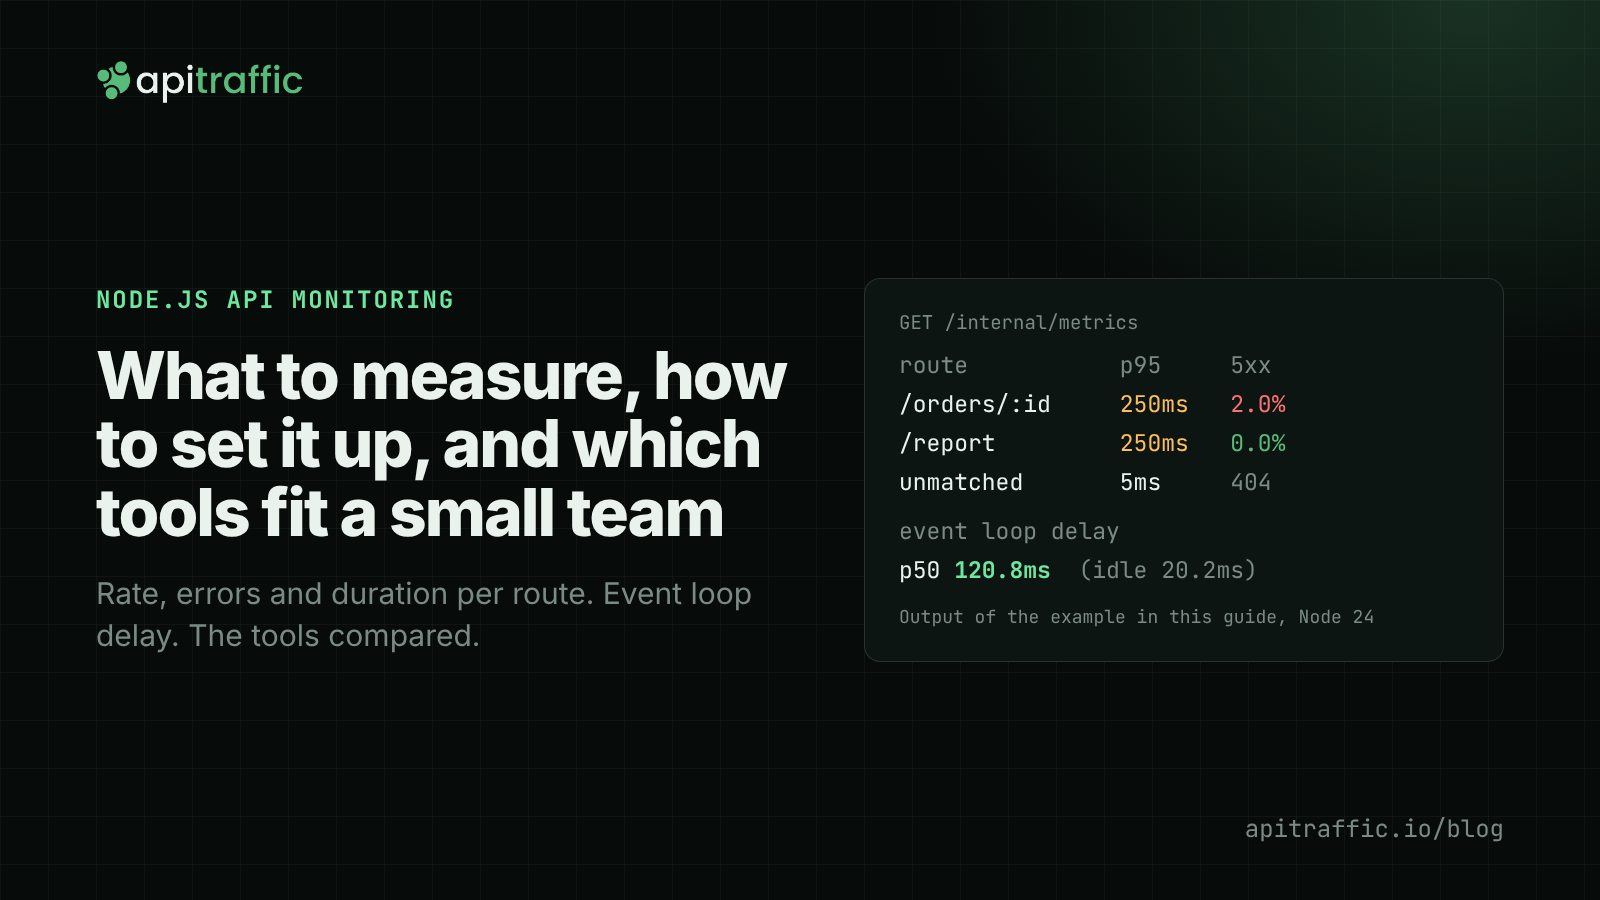
We sent 200 concurrent requests to /orders/:id, read the snapshot, then sent the same 200 alongside five calls to /report and one to a path that doesn’t exist. Output on Node 24.22 (Node 22.23 gave the same buckets):
orders only
  eventLoopDelayMs  { p50: 19.9, p99: 32.4 }
  GET /orders/:id   { requests: 200, rate5xx: 0.02, p50Ms: 100, p95Ms: 100, p99Ms: 100 }

orders plus 5 calls to /report
  eventLoopDelayMs  { p50: 120.8, p99: 141.3 }
  GET /orders/:id   { requests: 200, rate5xx: 0.02, p50Ms: 250, p95Ms: 250, p99Ms: 250 }
  GET /report       { requests: 5, p50Ms: 250 }
  GET unmatched     { requests: 1, rate4xx: 1 }
Five calls to one slow route moved every /orders/:id request from the 100 ms bucket to the 250 ms bucket, and /orders/:id itself didn’t change. Looking at that route alone, you would go hunting for a slow query that isn’t there. Event loop delay jumping to 120 ms points straight at blocking code.
monitorEventLoopDelay samples on a timer, and the Node.js docs describe the values as the delay of that timer. An idle process here reads about 20 ms at resolution: 20, so read the numbers relative to that baseline, or use a lower resolution. And the 404 shows up under unmatched instead of creating a new series per scanned path, which matters once bots start probing for /.env and /wp-login.php.
What this can’t tell you: which query or outbound call was slow inside a request, which customer was affected, what the request body was, or anything across more than one process. Each instance keeps its own numbers. To combine them you either export them to a metrics system (the prom-client package exposes the same data in Prometheus format, with histograms you can aggregate across instances) or move to tracing.
OpenTelemetry for Node.js
OpenTelemetry is the vendor-neutral standard for traces, metrics and logs. For Node it offers zero-code instrumentation: one package patches Express, Fastify, http, pg, mysql2, ioredis, mongodb and others as they load, and every request becomes a trace with child spans for the work inside it.
npm install @opentelemetry/api @opentelemetry/auto-instrumentations-node

OTEL_SERVICE_NAME=orders-api \
OTEL_TRACES_EXPORTER=console \
OTEL_METRICS_EXPORTER=none \
OTEL_LOGS_EXPORTER=none \
node --require @opentelemetry/auto-instrumentations-node/register server.js
Running that against the server above and calling GET /orders/7 printed spans named GET /orders/:id with http.route: '/orders/:id' and http.response.status_code: 200, plus spans for each Express middleware and the route handler, all sharing one trace ID. The route pattern grouping from the previous section comes built in.
The console exporter is for testing. In production you point OTEL_EXPORTER_OTLP_ENDPOINT at a backend that stores and queries traces. Most of the effort goes into what happens next: choosing the backend (self-hosted Jaeger or Grafana Tempo, or one of the many hosted services that accept OTLP), often running an OpenTelemetry Collector between your app and the backend to batch, sample and filter, deciding on a sampling rate so storage stays affordable, and building the dashboards and alerts yourself. The instrumentation takes an afternoon. A setup you trust during an incident usually takes longer.
Instrumentation has to load before the libraries it patches, which is why --require (or --import for ES modules) is the safe way to start it. And traces describe timing and structure: they record that a request took 1.8 seconds and which span was slow, but not the request body or the response your API sent, which is often what you need when the bug is “the export is missing rows.” If context propagation across services is new to you, read that first.
Node.js monitoring tools compared
The right pick depends on which of the four layers you need first and how much setup your team can own. Descriptions cover what each is built for; check current pricing and limits on each vendor’s site.
| Option | What it answers best | Setup effort for a small team | Good fit for |
|---|---|---|---|
| Prometheus + Grafana (with prom-client) | RED and saturation metrics over time, custom dashboards, alert rules | Medium to high: you run and retain the metrics store, or use a hosted version | Teams that want full control and already run infrastructure |
| OpenTelemetry + a tracing backend | Where time goes inside each request, across services, without vendor lock-in | Medium to high: instrumentation is quick, the backend, sampling and dashboards are not | Teams with several services, or a requirement to keep data portable |
| Error trackers (for example Sentry) | Exceptions with stack traces, grouped by release and affected users | Low | Every team, for “what threw, in which release” |
| APM platforms (for example Datadog, New Relic, AppSignal) | Traces, metrics, logs and often infrastructure in one hosted product | Low to medium: install an agent, then tune what it collects | Teams that want breadth and are ready to manage a larger platform |
| API-focused tools (for example Apitally, Treblle, Moesif, ApiTraffic) | Per-endpoint traffic, consumers and request detail, built around the API rather than the host | Low: an SDK or middleware | Teams whose product is the API, or who need request-level evidence fast |
A two-person team with one Node service usually needs an error tracker and request-level visibility on day one, and APM when the first “it’s slow” ticket arrives. A team with several services and someone who owns infrastructure is where Prometheus or OpenTelemetry starts to repay its setup time. Our post on observability for a small Node team walks through that decision in more detail.
Overlap is normal. Plenty of teams run an error tracker plus one other tool, and that’s fine as long as you know which tool answers which question when something breaks.
Alerts that matter
An alert should mean a human needs to act now. Everything else goes on a dashboard. For a small Node API, this short list catches most real incidents:
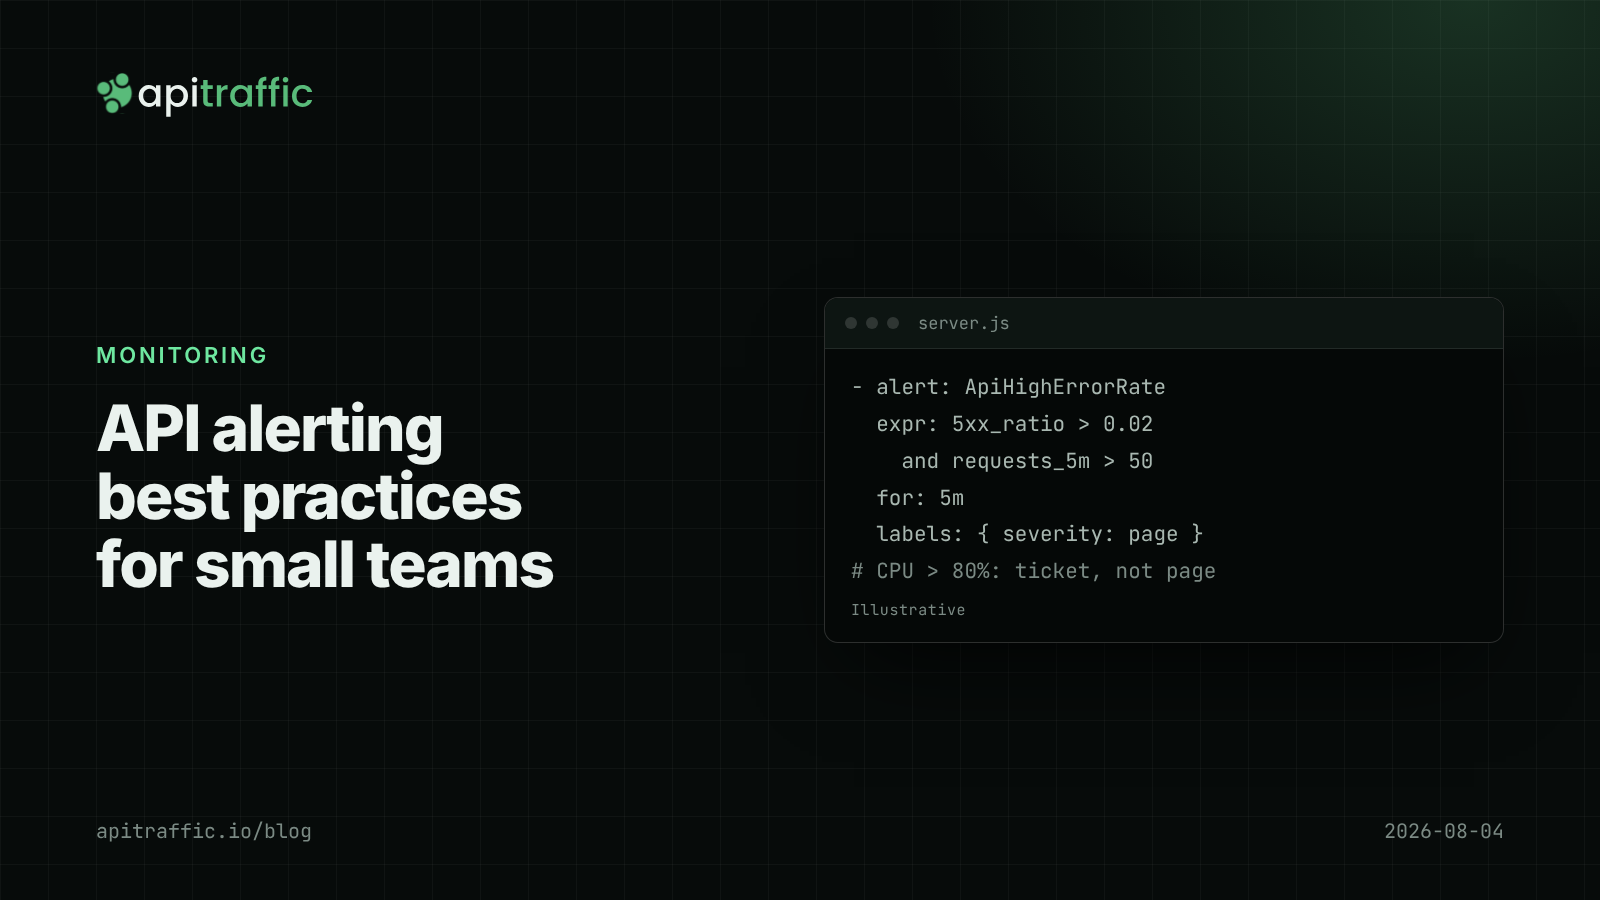
- 5xx rate per endpoint above your threshold for 5 to 10 minutes, with a minimum request count so one failure on a quiet endpoint doesn’t page anyone.
- A p95 latency regression: an endpoint’s p95 up by a large fraction against the previous window or the same hour last week. Relative thresholds catch regressions that absolute ones miss on fast endpoints.
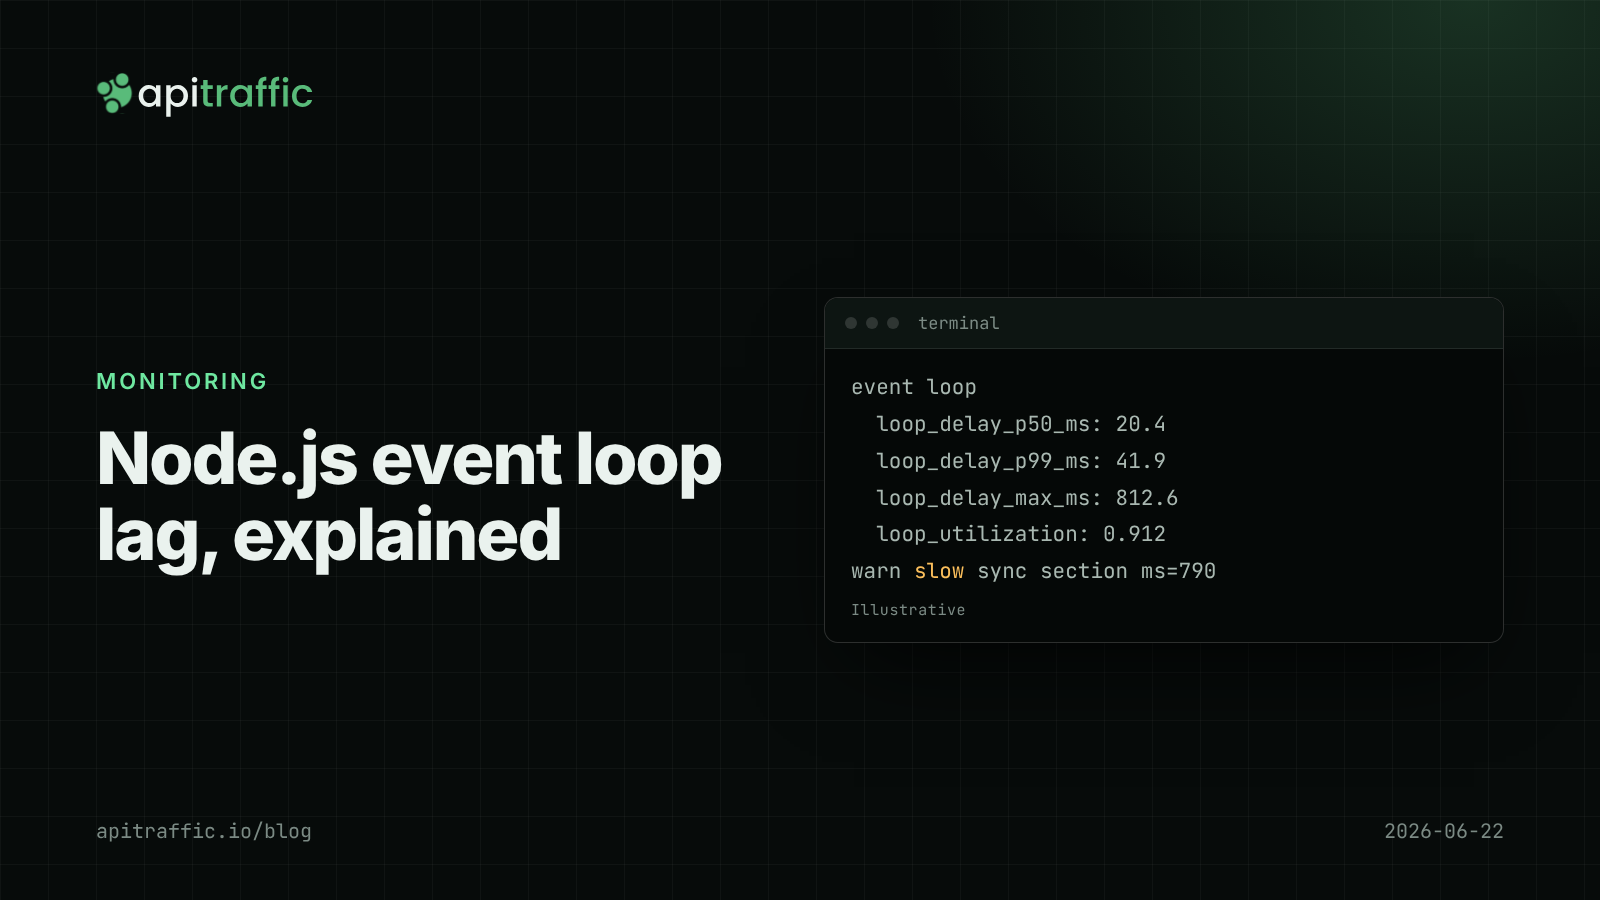
- Event loop delay p99 above a few hundred milliseconds for several minutes. Every route degrades when this fires.
- Outbound dependency errors or latency for a provider your core flow needs (payments, auth).
- Health check failing from outside your network, for the case where nothing else can report.
Then two that go to a channel instead of a pager: a jump in 401s or 404s from a small set of IPs (credential stuffing and scanning), and error-budget burn rate. Our API alerting best practices post covers thresholds, windows and routing in more depth.
Monitoring by framework
The layers and metrics above are the same in every Node framework. What differs is where you hook in and what the framework already gives you.
Express
Middleware runs in the order you register it, so monitoring middleware goes first and error-handling middleware last. req.route is only set after a route matches, which is why the example above reads it in the finish handler. Express 5 changed how async errors reach your error handler, so check your 5xx counts after migrating.
Fastify
Hooks (onRequest, onResponse, onError) are the natural place for RED metrics, and request.routeOptions.url gives you the route pattern. Fastify’s built-in Pino logger already records response time per request. See Fastify hooks for logging and auth.
NestJS
Interceptors see every request with the controller and handler names attached, which makes them a good place for per-route metrics. Remember that NestJS runs on Express or Fastify underneath, so the platform’s middleware still runs first. Our NestJS production checklist covers the rest.
Koa
One middleware wrapping await next() sees the full request duration and the final status. Route patterns come from your router (ctx._matchedRoute with @koa/router).
hapi
The onRequest and onPreResponse extension points, or the response event, give you timing and status, and request.route.path is the pattern.
AdonisJS
Global middleware wraps every request, and the router exposes the matched route pattern on the HTTP context.
Strapi
Strapi is built on Koa, so Koa-style middleware registered in config/middlewares sees every API request, including the content API routes Strapi generates.
Doing this with ApiTraffic
ApiTraffic is a Node SDK that covers the request-level, APM and security layers in one install. It supports Express 4.17+ and 5, Fastify 4 and 5, NestJS 10 to 12, Koa 2.13+ and 3, hapi 21, AdonisJS 6 and 7, LoopBack 4, Sails 1, Meteor 3 and Strapi 5, on Node 20 or later.
const express = require('express');
const apitraffic = require('@apitraffic/node');

const app = express();
app.use(express.json());         // body parsers first
app.use(apitraffic.express());   // then ApiTraffic, before your routes
What that gives you, per the ApiTraffic docs:
- A searchable request log of every inbound request with headers and bodies, plus the outbound calls your app made with
http,httpsorfetch. Tag requests withapitraffic.tag('customerId', id)and the export example above becomes one filter. - APM with
@apitraffic/apmand the preload (node -r @apitraffic/node/register ./server.js): spans for database queries, Redis, caches and outbound HTTP inside each request, attributed to the request that started them. - Signals on the dashboard for error rate, error hotspots, p95 latency regressions and slow endpoints, and workflows that send alerts to your own tools.
- A firewall in front of your routes. Start a policy in Monitor mode to see what it would block, then switch it to enforcing.
It works next to what you already run. Keep your error tracker for exceptions. If your app already runs OpenTelemetry, add ApiTraffic’s span processor to your existing setup; with Datadog or New Relic running, request capture works as usual and the bundled APM setup steps aside instead of instrumenting every driver twice.
See what’s hitting your API: apitraffic.io
FAQ
What is the best way to monitor a Node.js API?
Start with RED metrics per route pattern (request rate, 4xx and 5xx rates, p50/p95/p99 latency) and event loop delay, plus an external uptime check. Add tracing when you need to know which query or dependency made a request slow, and a request log when you need to see what a specific customer sent. Which tool you use matters less than grouping by route and alerting on percentiles.
Do I need APM for a small Node.js API?
Not on day one. If your API mostly reads from one database and your p95 is healthy, RED metrics and an error tracker cover most incidents. APM earns its place the first time a route gets slow and the metrics can’t tell you whether it was the query, the cache, the event loop or a third-party call.
How much overhead does Node.js monitoring add?
It depends on what you record. Counting requests and timing them, as in the middleware above, costs very little. Tracing every span and capturing request bodies costs more, mostly in memory and network, and sampling is the usual way to control it. Measure it yourself: compare p95 and CPU with monitoring on and off under the same load before you roll it out.
What are the most important Node.js API metrics?
Per route: request rate, 5xx rate, 4xx rate and p95/p99 latency. Per process: event loop delay, heap used and database pool usage. Per dependency: latency and error rate of each outbound host. Those cover the large majority of production incidents in a typical Node API.
Is OpenTelemetry enough to monitor a Node.js API?
OpenTelemetry handles the instrumentation and is a solid foundation. It is not a backend: you still need somewhere to store and query the data, plus dashboards and alerts on top. It also records timing and structure rather than request and response bodies, so many teams pair it with a request log or error tracker.
Keep reading
API latency percentiles: how to read p50, p95 and p99 without fooling yourself
Your average latency says 102 ms; a customer says the app hangs for two seconds. Both are true. Learn to read p50, p95 and p99, avoid the four classic mistakes, and record percentiles per route in Node.
API alerting best practices: what to page on for a Node API
A 3am CPU page that meant nothing, then a real outage that paged nobody. Here is the short list of alerts a small Node API team needs, with rules and code to match.
Node.js event loop lag: the metric that explains "random" slowness
Every endpoint slow at once, database fine, CPU looks idle: that is event loop lag. Here is how to measure it in Node with built-in tools and find the code that blocks.