
Posts tagged “OpenTelemetry”

AdonisJS monitoring and logging: the built-in logger, request logs and APM
AdonisJS ships a Pino logger and health checks but logs no requests and sends raw error messages on a 500. How to add request logs by route, metrics, OpenTelemetry tracing and a safer exception handler, tested on AdonisJS 7.

hapi monitoring and logging: hapi-pino, request lifecycle events and APM
hapi 21 gives you a hook for every layer of monitoring. Set up hapi-pino with redaction, per-route Prometheus metrics, Boom error logging and OpenTelemetry traces, with code we ran and the output it printed.

Koa monitoring and logging: request logs, metrics and APM for Koa 2 and 3
A Koa timing middleware that only uses try/finally logs every crash as a 404. How to set up Koa logging with pino, per-route metrics with prom-client, error reporting and OpenTelemetry traces, tested on Koa 2 and 3.

Fastify monitoring: hooks, metrics and APM for Fastify 4 and 5
Set up Fastify monitoring that shows which route got slow and why: onResponse timings, fastify-metrics histograms, @fastify/otel spans per hook, and under-pressure load shedding, with output from real runs.

NestJS monitoring: metrics, APM and tracing that see guards and interceptors
NestJS monitoring that counts every request: per-route Prometheus metrics from middleware, OpenTelemetry tracing on NestJS 11 and 12, and what interceptors miss.

Express monitoring: route-level metrics, APM and alerts for Express 4 and 5
Most Express metrics are labelled by raw URL and miss async errors. Build route-level metrics with prom-client, add OpenTelemetry in the right load order, and set alerts, with code we ran on Express 4.22.3 and 5.3.0.
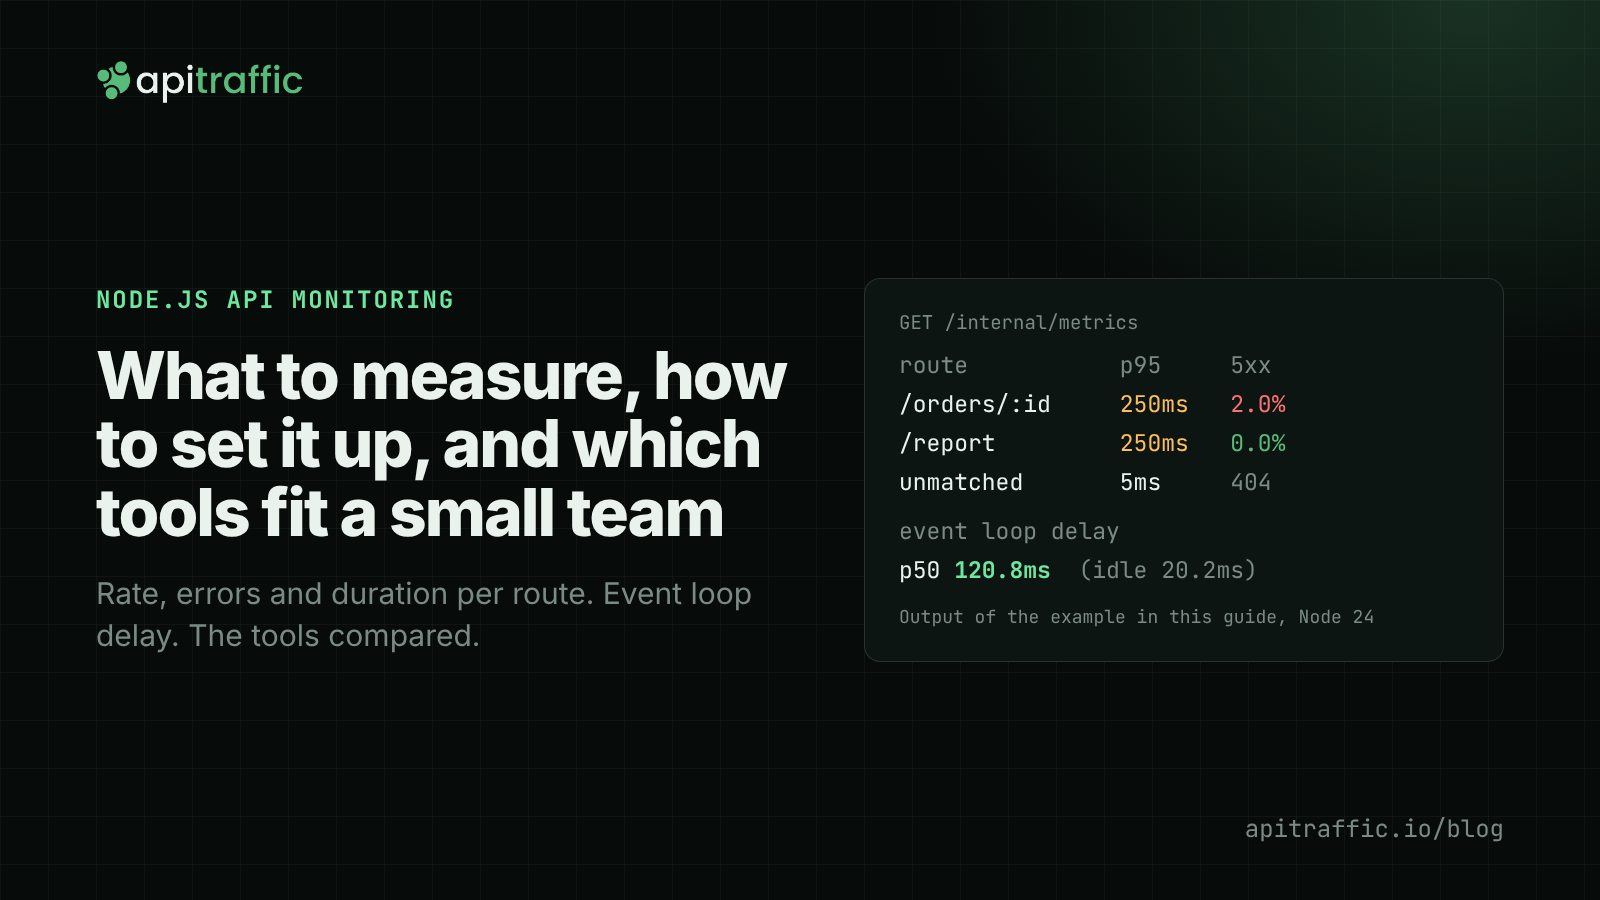
Node.js API monitoring: what to measure, how to set it up, and which tools fit a small team
Uptime checks miss most of what breaks a Node API. What to measure per route and per process, a tested Express middleware for RED metrics and event loop delay, where OpenTelemetry fits, a fair tool comparison and the alerts worth paging on.
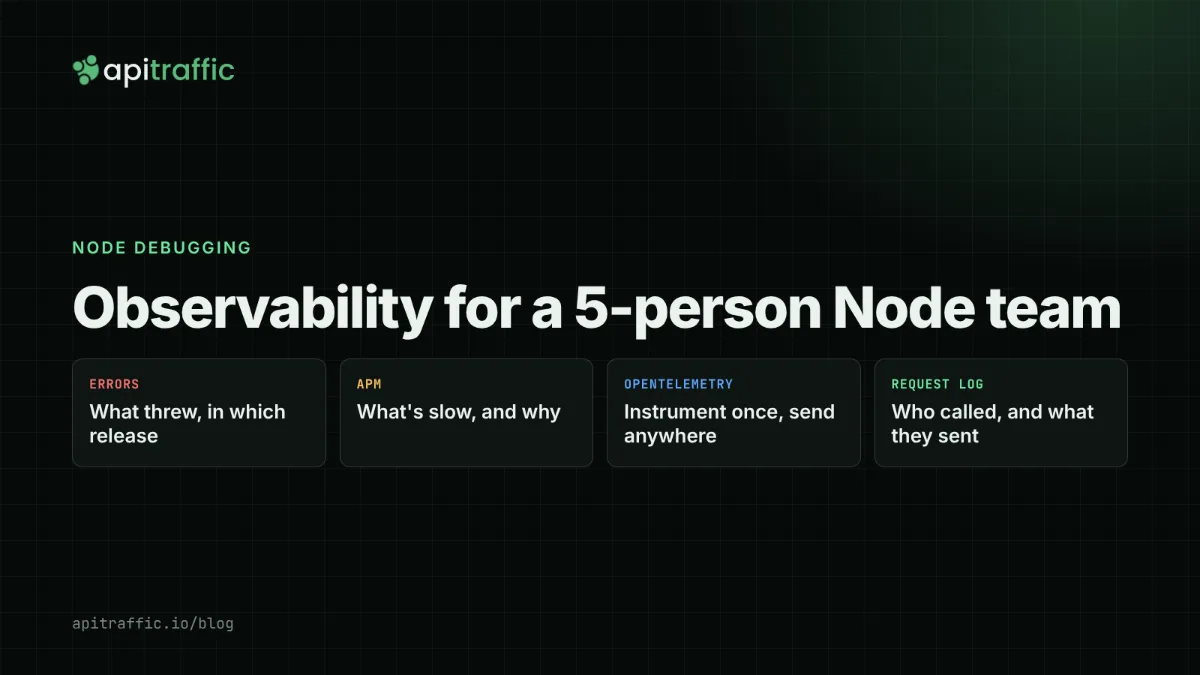
Observability for a 5-person Node team: what each option actually gives you
When a customer says the export failed again, how long until you see the exact request? For most small Node teams the answer is spread across three tools. Here's what each option is built for, the gaps that bite, and a setup you can copy.