
NestJS monitoring: metrics, APM and tracing that see guards and interceptors
Count every Nest request with its real status, including guard 403s, pipe 400s and 404s, on NestJS 11 and 12.

NestJS monitoring comes down to three signals per route pattern: request rate, error rate and latency (p95 and p99), plus the process-level saturation numbers that explain them (event loop lag, memory, pool usage). The Nest-specific part is where you collect them. Record metrics from middleware on the response’s finish event, not from an interceptor, or you will miss every request a guard rejects, every unmatched path, and count pipe failures as successes. For tracing, NestJS 12 needs the OpenTelemetry ESM loader hook, and the Nest-specific spans you got on NestJS 11 are not there yet.
Everything below was run in a sandbox on Node 22.23.4 against NestJS 12.5.0 and NestJS 11.2.10 (Express platform, Express 5.2.1), plus NestJS 12.5.0 on the Fastify platform (Fastify 5.12.8). The output you see is from those runs. If you’re choosing an approach for a whole Node API rather than one framework, start with the hub guide on Node.js API monitoring.
Where a monitoring hook has to sit in the Nest request lifecycle
The NestJS request lifecycle runs in this order: middleware, guards, interceptors (before the handler), pipes, the route handler, interceptors (after), then exception filters. Each stage can end the request early:
- A guard returns
falseand Nest answers403before any interceptor runs. - No route matches and Nest’s not-found handler answers
404. No guard, interceptor or pipe runs at all. - A pipe such as
ParseIntPipethrows, and an exception filter answers400.
Most “NestJS metrics” snippets use a global interceptor because it has a clean ExecutionContext. We tested that against a guarded GET /api/users/:id with five requests: two that succeed, one with no account header (guard 403), one with id=abc (pipe 400) and one to /api/nope (404). This is the naive interceptor:
@Injectable()
export class CountInterceptor implements NestInterceptor {
  constructor(@InjectMetric('interceptor_requests_total') private readonly c: Counter<'status_code'>) {}
  intercept(ctx: ExecutionContext, next: CallHandler) {
    const res = ctx.switchToHttp().getResponse();
    return next.handle().pipe(finalize(() => this.c.inc({ status_code: String(res.statusCode) })));
  }
}
And what it recorded, on both NestJS 11 and 12:
interceptor_requests_total{status_code="200"} 3
Three requests, all 200. The 403 and 404 never reached it. The 400 did, but the pipe threw before the exception filter set the status, so the interceptor read the default 200. A dashboard built on this shows a 100% success rate while users get errors. The NestJS production checklist makes the same point about request logs; metrics have the same blind spot.
Metrics with @willsoto/nestjs-prometheus
prom-client is now deprecated on npm with the message “prom-client has been replaced by @prometheus-io/client” (npm). @willsoto/nestjs-prometheus 7.0.0 takes @prometheus-io/client as its peer dependency and supports NestJS 7 through 12. If you’re on 6.x with prom-client, the code below is the same apart from the import.
npm install @willsoto/nestjs-prometheus @prometheus-io/client
Register the module and a histogram. PrometheusModule.register() adds a /metrics endpoint and collects the client’s default Node.js metrics.
// app.module.ts
import { MiddlewareConsumer, Module, NestModule } from '@nestjs/common';
import { PrometheusModule, makeHistogramProvider } from '@willsoto/nestjs-prometheus';
import { HttpMetricsMiddleware } from './http-metrics.middleware.js';
import { UsersController } from './users.controller.js';

@Module({
  imports: [PrometheusModule.register({ path: '/metrics' })],
  controllers: [UsersController],
  providers: [
    makeHistogramProvider({
      name: 'http_request_duration_seconds',
      help: 'HTTP request duration by route pattern',
      labelNames: ['method', 'route', 'status_code'],
      buckets: [0.01, 0.025, 0.05, 0.1, 0.25, 0.5, 1, 2.5, 5],
    }),
  ],
})
export class AppModule implements NestModule {
  configure(consumer: MiddlewareConsumer) {
    consumer.apply(HttpMetricsMiddleware).exclude('metrics').forRoutes('{*path}'); // '*' on Nest 10
  }
}
Then the middleware. It starts the timer when the request arrives and records on finish, after guards, pipes and filters have all had their say:
// http-metrics.middleware.ts
import { Injectable, NestMiddleware } from '@nestjs/common';
import { InjectMetric } from '@willsoto/nestjs-prometheus';
import type { Histogram } from '@prometheus-io/client';
import type { Request, Response, NextFunction } from 'express';

@Injectable()
export class HttpMetricsMiddleware implements NestMiddleware {
  constructor(
    @InjectMetric('http_request_duration_seconds')
    private readonly duration: Histogram<'method' | 'route' | 'status_code'>,
  ) {}

  use(req: Request, res: Response, next: NextFunction) {
    const end = this.duration.startTimer();
    res.on('finish', () => {
      // Nest answers unmatched paths from its own catch-all route ('*path'),
      // so keep those out of the per-route series.
      const path = req.route?.path;
      const route = path && !String(path).endsWith('*path') ? req.baseUrl + path : 'unmatched';
      end({ method: req.method, route, status_code: String(res.statusCode) });
    });
    next();
  }
}
With app.setGlobalPrefix('api', { exclude: ['metrics'] }) and the same five requests, /metrics showed:
http_request_duration_seconds_count{method="GET",route="/api/users/:id",status_code="200"} 2
http_request_duration_seconds_count{method="GET",route="/api/users/:id",status_code="403"} 1
http_request_duration_seconds_count{method="GET",route="/api/users/:id",status_code="400"} 1
http_request_duration_seconds_count{method="GET",route="unmatched",status_code="404"} 1
Each of the five requests appears with its real status, under its route pattern when it had one.
The *path check matters on NestJS 12. Without it, the 404 was labeled route="/api*path", because Nest 12’s Express adapter answers unmatched paths from a catch-all router.all('*path') mounted under the global prefix, and that sets req.route. NestJS 11.2.10 left req.route empty for the same request. The check handles both.
Label by route pattern, never by raw URL. /api/users/:id is one series. /api/users/8812 is one series per user. The Prometheus docs warn against labels with high cardinality “such as user IDs, email addresses, or other unbounded sets of values”. The same goes for the unmatched bucket: scanners send thousands of distinct paths, and collapsing them keeps your metrics bill flat.
Histogram buckets
Pick buckets around the latencies you care about. The set above runs from 10 ms to 5 s, with more resolution under 250 ms where most API routes live. Put a bucket edge on your target: if the SLO is “95% of requests under 300 ms”, a bucket at 0.25 and another at 0.5 make the p95 estimate coarse around the number you’ll alert on, so add 0.3. Prometheus computes quantiles from buckets by interpolation (histogram_quantile), so the estimate is only as good as the edges near it.
Per-route p95 and error rate in PromQL
# p95 latency per route pattern, last 5 minutes
histogram_quantile(0.95,
  sum by (le, route) (rate(http_request_duration_seconds_bucket{route!="unmatched"}[5m])))

# 5xx ratio per route
sum by (route) (rate(http_request_duration_seconds_count{status_code=~"5.."}[5m]))
  / sum by (route) (rate(http_request_duration_seconds_count[5m]))
Watch 4xx per route as its own series. A jump in 403 on one route after a deploy usually means a guard changed, and the interceptor approach would never have shown it. Our guide to reading latency percentiles covers why p95 and p99 tell you different things.
Saturation: event loop lag and memory come for free
PrometheusModule.register() turns on the client’s default metrics, which include Node.js event loop lag, heap, resident memory, GC and active handles. From the test run:
nodejs_eventloop_lag_p99_seconds 0.010797055
process_resident_memory_bytes 111235072
Event loop lag is the one to alert on for a Nest API. When the p99 lag climbs, every route’s latency climbs with it, and per-route p95 alone won’t tell you why. See Node.js event loop lag for what pushes it up. If you use a database pool, export its in-use and waiting counts as gauges too; pool starvation shows up as rising p95 with flat CPU.
Request-scoped providers are a Nest-specific source of latency. A Scope.REQUEST provider makes everything that depends on it request-scoped too, so a chunk of your DI graph is rebuilt per request. The production checklist has the details. Per-route p95 is how you’d see the cost: compare a route before and after the change.
On the Fastify platform
Nest middleware runs in Fastify’s onRequest stage, and Fastify already times every request. Use an onResponse hook on the underlying instance instead:
// main.ts (NestJS 12, @nestjs/platform-fastify)
const app = await NestFactory.create<NestFastifyApplication>(AppModule, new FastifyAdapter());
app.setGlobalPrefix('api');

app.getHttpAdapter().getInstance().addHook('onResponse', async (req, reply) => {
  duration.observe(
    { method: req.method, route: req.routeOptions.url ?? 'unmatched', status_code: String(reply.statusCode) },
    reply.elapsedTime / 1000,
  );
});
Here duration is the same histogram, created with new Histogram({...}) from @prometheus-io/client. With the same four kinds of request (200, guard 403, pipe 400, unmatched 404), we got one series per outcome and route="unmatched" for the 404, because Fastify leaves routeOptions.url undefined when nothing matched.
OpenTelemetry tracing for NestJS
Metrics tell you which route is slow. Traces tell you which part of the request was slow: the guard, the handler, the database call or an outbound API. The standard setup is the OpenTelemetry Node SDK with the HTTP, Express and Nest instrumentations, loaded before Nest:
// tracing.ts
import { NodeSDK } from '@opentelemetry/sdk-node';
import { HttpInstrumentation } from '@opentelemetry/instrumentation-http';
import { ExpressInstrumentation } from '@opentelemetry/instrumentation-express';
import { NestInstrumentation } from '@opentelemetry/instrumentation-nestjs-core';

const sdk = new NodeSDK({
  serviceName: 'users-api',
  instrumentations: [new HttpInstrumentation(), new ExpressInstrumentation(), new NestInstrumentation()],
  // traceExporter: defaults to OTLP over http/protobuf (OTEL_EXPORTER_OTLP_ENDPOINT)
});
sdk.start();
process.on('SIGTERM', () => sdk.shutdown().finally(() => process.exit(0)));
Tested with @opentelemetry/sdk-node 0.301.2, instrumentation-http 0.301.2, instrumentation-express 0.73.0 and instrumentation-nestjs-core 0.72.1. We printed every span the SDK produced. The results differ a lot between Nest versions.
NestJS 11: preload with --require
On NestJS 11 (CommonJS), node --require ./dist/tracing.js dist/main.js works as documented. A successful request produced these spans (trimmed to name, attributes and duration):
GET /api/users/:id               route=/api/users/:id  status=200  30.86 ms
request handler - /api/users/:id                                   28.15 ms
UsersController.findOne          nestjs.type=request_context       25.85 ms
findOne                          nestjs.type=handler               20.39 ms
middleware - jsonParser                                             0.25 ms
The gap between request_context (25.85 ms) and handler (20.39 ms) is the time spent in guards, interceptors and pipes. The Nest instrumentation doesn’t create a span per guard, so that subtraction is how you find a slow guard. For the guard’s 403 the trace had request_context (1.01 ms) and no handler span. The 404 produced a server span named just GET with no route.
NestJS 12: you need the ESM loader hook
NestJS 12 ships as ES modules ("type": "module" in @nestjs/core and @nestjs/platform-express). OpenTelemetry’s --require preload patches modules loaded with require(), so when we ran the same CommonJS-compiled app on NestJS 12 with --require, every request produced a single span:
GET  status=200  28.52 ms
GET  status=403   1.91 ms
GET  status=404   1.21 ms
The spans carried no route, and there were no Express or Nest spans at all. Following the OpenTelemetry ESM support notes, register the loader hook before anything else loads:
// instrumentation.mts
import { register } from 'node:module';
register('@opentelemetry/instrumentation/hook.mjs', import.meta.url);
await import('./tracing.js');
node --import ./dist/instrumentation.mjs dist/main.js
That brought back the HTTP and Express spans with http.route, for both an ESM build and a CommonJS build of the app. It did not bring back the Nest spans: @opentelemetry/instrumentation-nestjs-core 0.72.1 lists supported versions as @nestjs/core >=4.0.0 <12 (npm). On NestJS 12 you get route-level traces from the Express layer, and anything inside the handler (database, cache, outbound HTTP) from those libraries’ own instrumentations. Unmatched paths showed up as GET /api*path, Nest’s catch-all route again.
Request-scoped providers and tracing
Tracing context in OpenTelemetry Node lives in AsyncLocalStorage, so you don’t need a request-scoped provider to get the current trace ID into a log line or a service. Reading it with trace.getActiveSpan()?.spanContext().traceId keeps your providers singleton. Propagating that context across services is covered in W3C trace context in Node.
NestJS monitoring options compared
| Option | What it answers | Setup effort | Good fit for |
|---|---|---|---|
@willsoto/nestjs-prometheus + Prometheus/Grafana |
Per-route rate, errors, latency; process saturation | Low in the app; you run Prometheus and Grafana (or a hosted version) | Teams that want open metrics and already run, or are happy to run, Prometheus |
| OpenTelemetry SDK + a tracing backend (Jaeger, Grafana Tempo, or a vendor that accepts OTLP) | Where time goes inside a request, across services | Medium: preload, loader hook on Nest 12, a collector or OTLP endpoint | Several services, or a slow route you can’t explain from metrics |
| Agent-based APM vendors (Datadog, New Relic, Elastic APM, Dynatrace and others) | Traces, metrics and dashboards from one agent | Low to medium; check the agent’s NestJS 12 support before upgrading | Teams that want one hosted product and are fine with per-host or usage pricing |
| Error trackers with performance features (Sentry and similar) | Exceptions with stack traces, plus sampled transactions | Low | Catching and triaging errors; lighter on per-route metrics |
| Request-level API monitoring (ApiTraffic and similar) | Every request with its status and matched route, plus the spans inside it | Low: one module | Small teams that want request evidence, not just aggregates |
These combine. A small team can run Prometheus for per-route metrics and alerts, then use traces or request logs to explain what went wrong on a route.
Doing this with ApiTraffic
@apitraffic/nestjs is a Nest module you import once in the root module. It works on NestJS 10, 11 and 12, on the Express and Fastify platforms, with nothing to change in main.ts (docs):
@Module({
  imports: [ApiTrafficModule.forRoot({ token: process.env.API_TRAFFIC_TOKEN, bucket: process.env.API_TRAFFIC_BUCKET })],
})
export class AppModule {}
It runs ahead of Nest’s body parser, middleware, guards and router, so it records the requests an interceptor misses: guard 401/403, a middleware’s own 401, unmatched 404, and handlers that throw. The route Nest matched is sent with each request, global prefix and URI version included, and endpoint latency is charted as p50, p95 and p99. For spans inside the request (database, cache, queue, GraphQL, gRPC and fetch/undici), install @apitraffic/apm and preload with node -r @apitraffic/nestjs/register dist/main.js. If you already run OpenTelemetry, add ApiTrafficSpanProcessor to your provider instead. NestJS 12 needs Node 20.19+ or 22.12+ for the module.
FAQ
How do I monitor a NestJS application in production?
Export per-route request rate, error rate and latency histograms from middleware, scrape them with Prometheus (or a hosted equivalent), and alert on p95 latency, 5xx ratio and event loop lag. Add tracing when a slow route needs explaining. Record on the response’s finish event so guard rejections and 404s are counted.
Should I use an interceptor or middleware for NestJS metrics?
Middleware. Interceptors run after guards, so they never see a guard’s 403 or an unmatched 404, and in our test a pipe’s 400 was recorded as a 200 because the interceptor finished before the exception filter set the status. Use interceptors for handler-only timing if you want it, as a second metric.
Does OpenTelemetry work with NestJS 12?
Partly, as of @opentelemetry/instrumentation-nestjs-core 0.72.1, which supports @nestjs/core below 12. With the ESM loader hook registered via --import, the HTTP and Express instrumentations produce route-level spans on NestJS 12. The Nest-specific request_context and handler spans are missing until that instrumentation adds 12.
What is the best Prometheus package for NestJS?
@willsoto/nestjs-prometheus is the common choice: it registers a /metrics endpoint, default Node.js metrics, and injectable counters, gauges and histograms. Version 7 uses @prometheus-io/client, the renamed prom-client. You can also use @prometheus-io/client directly, as in the Fastify example above.
How much overhead does NestJS monitoring add?
We didn’t benchmark it, and you should measure on your own routes. A histogram observation per request is cheap next to a typical handler. Tracing costs more because it creates several spans per request; the SDK’s sampler lets you trace a fraction of requests while metrics still count all of them.
Next up in this series: NestJS logging, and for Express without Nest, Express monitoring. The Node.js API logging hub covers what to put on every request’s log line.
See what’s hitting your API: apitraffic.io
Keep reading
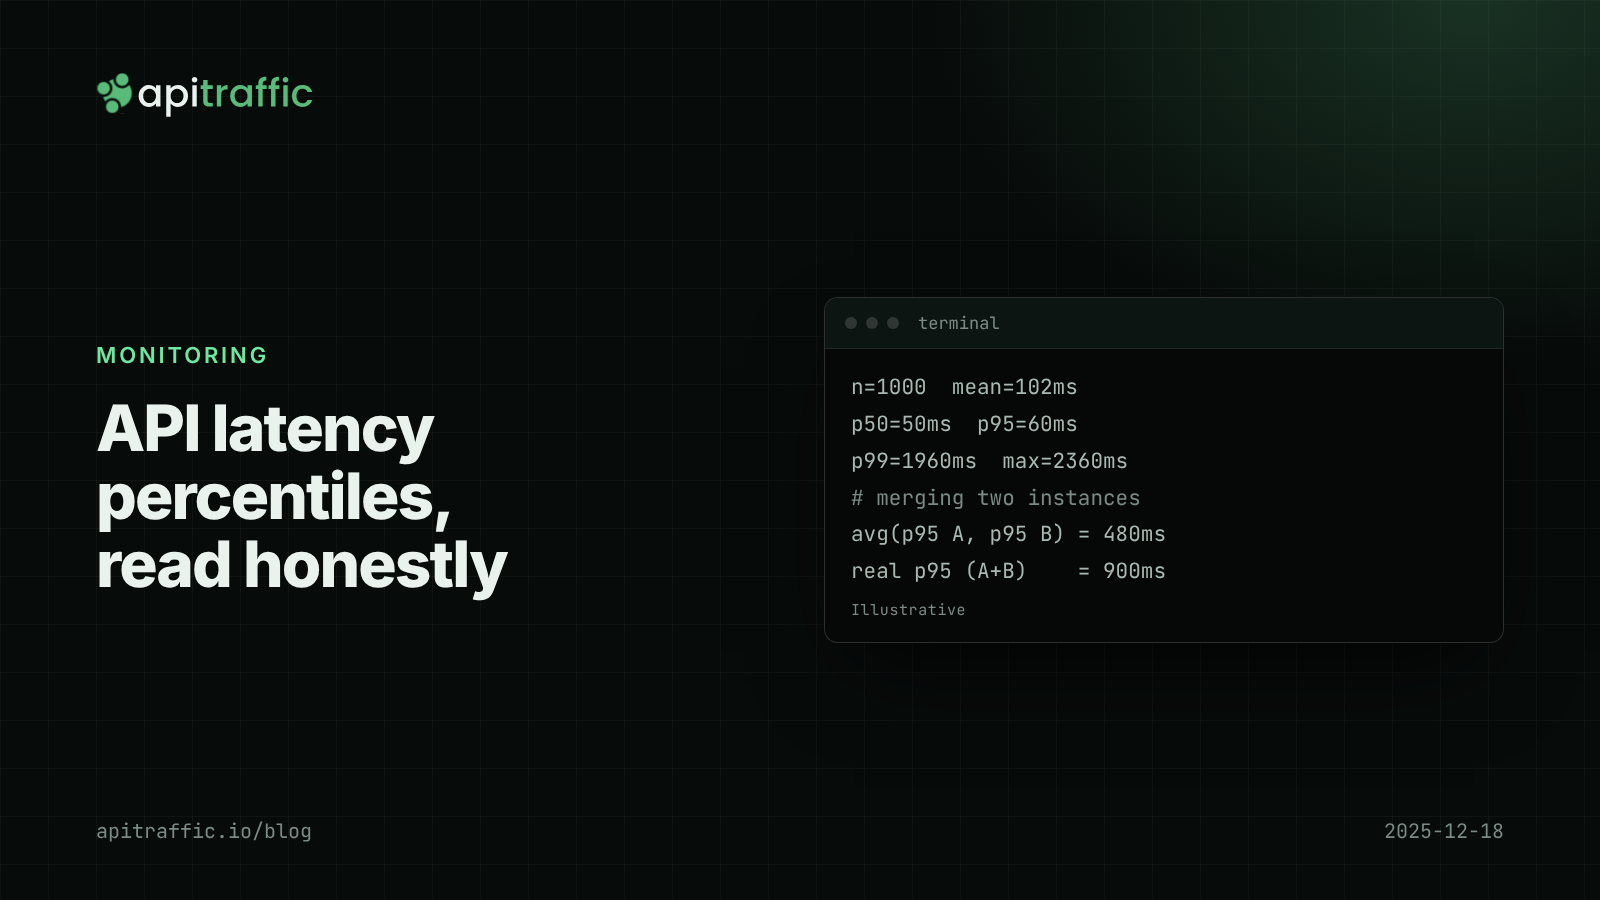
API latency percentiles: how to read p50, p95 and p99 without fooling yourself
Your average latency says 102 ms; a customer says the app hangs for two seconds. Both are true. Learn to read p50, p95 and p99, avoid the four classic mistakes, and record percentiles per route in Node.
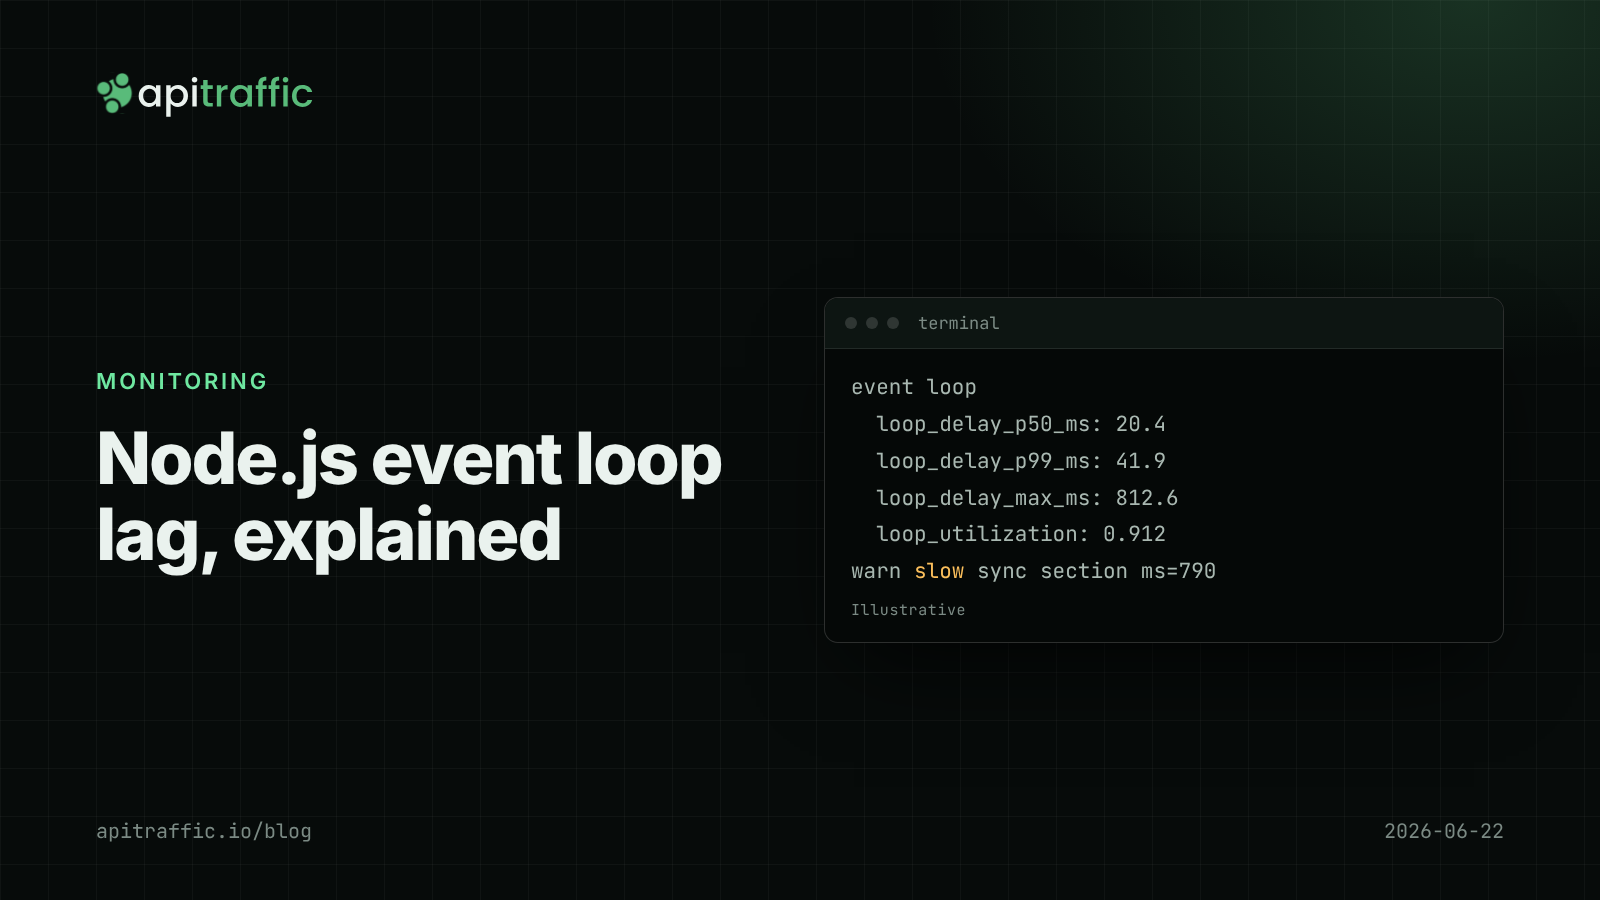
Node.js event loop lag: the metric that explains "random" slowness
Every endpoint slow at once, database fine, CPU looks idle: that is event loop lag. Here is how to measure it in Node with built-in tools and find the code that blocks.

W3C Trace Context in Node.js: correlating requests across services with traceparent
Three services, three log streams, one failed order, and nothing to join them on. W3C Trace Context gives every hop the same trace ID. Here is how to propagate traceparent in Node with OpenTelemetry, or in 30 lines without it.