
Node.js API logging: what to log for every request, and how
One structured line per request, capped body capture, redacted secrets, and the queries that answer support tickets.
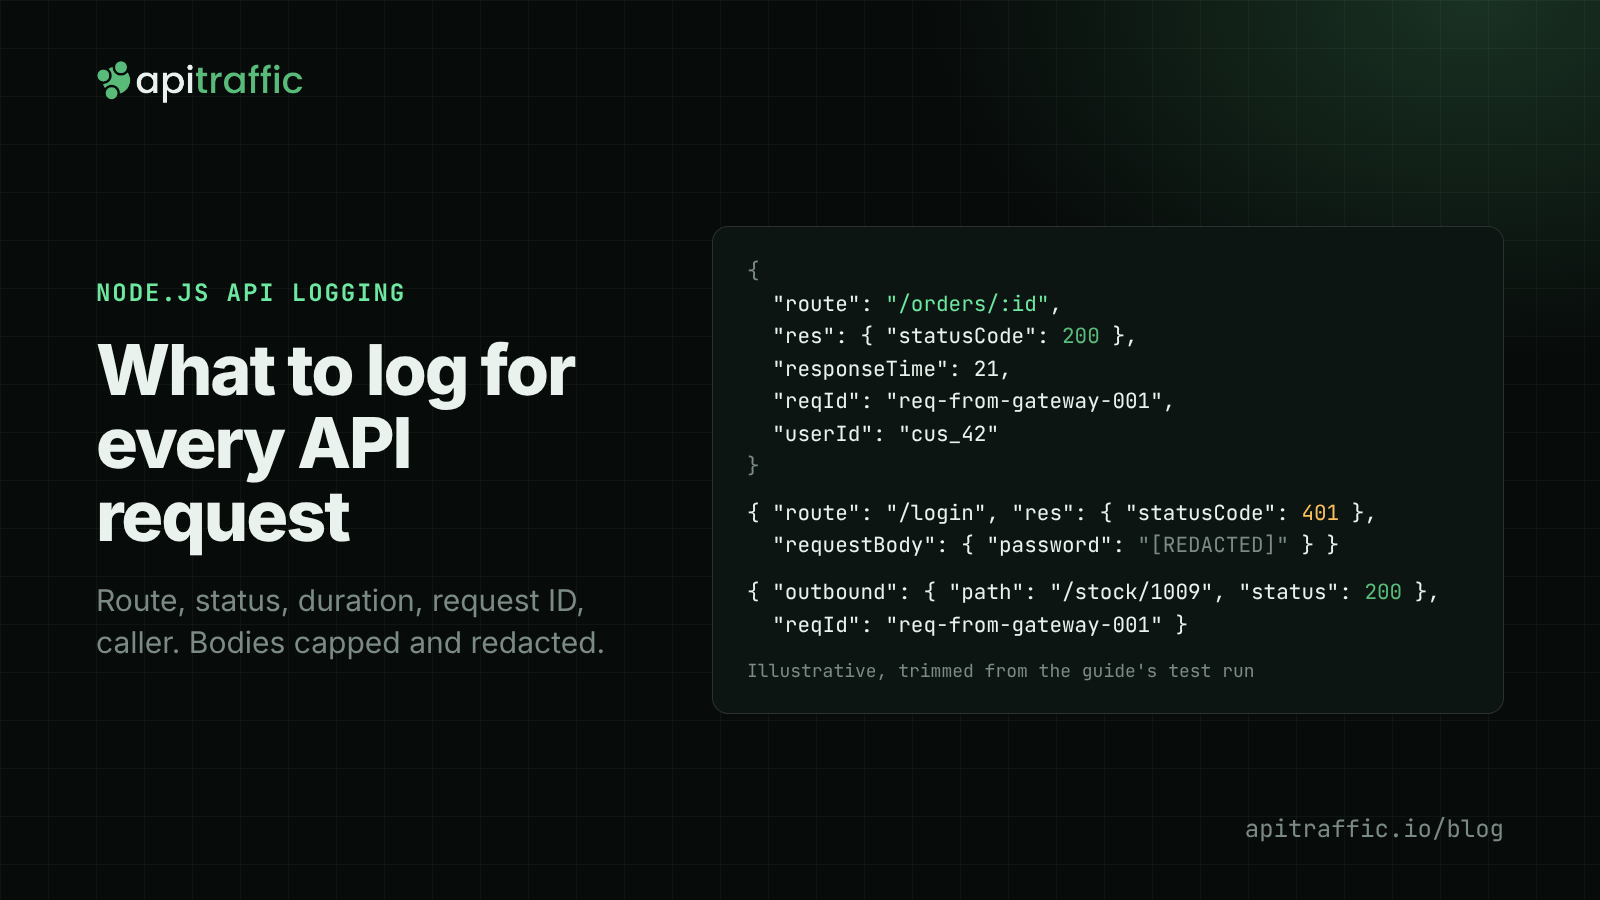
Node.js API logging comes down to one structured line per request with six fields: the HTTP method, the route pattern (/orders/:id, not /orders/1009), the status code, the duration, a request ID and the caller’s ID. Add request and response bodies only with a size cap and redaction, keep passwords, tokens and card numbers out of every line, and log outbound calls with the same request ID. This guide builds that setup with pino and pino-http, shows how to capture response bodies without breaking streaming, and ends with the queries those logs need to answer. Every code sample was run on Node.js 22.23 and 24.22 with Express 5.3, pino 10.4 and pino-http 11.0.
Node.js API logging checklist: what every request line needs
Each field below is there because someone will ask a question that needs it.
| Field | Example | The question it answers |
|---|---|---|
| Method and route pattern | GET /orders/:id |
Which endpoint is slow or failing? Raw URLs split one endpoint into thousands of rows. |
| Status code | 401 |
Is this a client problem, an auth problem or our bug? |
| Duration | responseTime: 21 (ms) |
Did it get slower, and for whom? |
| Request ID | req-from-gateway-001 |
Which other log lines belong to this request? |
| Caller ID | userId: "cus_42" |
Which customer saw this? |
| Outbound calls | GET /stock/1009 200 8ms |
Was it us or the service we called? |
Two more are worth having when you can get them cheaply: the response size in bytes, and the client IP or API key fingerprint for security questions. The OWASP Logging Cheat Sheet has a longer list of event attributes if you need to satisfy an audit.
The list of what to leave out is just as specific. The same OWASP cheat sheet lists data that should usually be removed, masked or hashed before it reaches a log: session IDs, access tokens, passwords, database connection strings, encryption keys, payment card data and personal data that has no reason to be there. In practice that means no Authorization or Cookie headers, no raw request bodies from login, signup or payment routes, and no full query strings when your API takes tokens in them. If a field would let someone act as your user, it stays out.
Whether to log every request or sample is a cost decision, covered below. For an API doing a few million requests a day, logging every request line is normally affordable; logging every body is where the bill grows.
Access logs vs application logs vs request capture
People mean three different things by “API logging”, and each answers different questions.
Access logs are one line per request, written by a proxy (nginx, a load balancer) or by middleware like morgan. They tell you what came in and what went out: method, path, status, time, bytes. They can’t tell you why a request failed, and they don’t know which customer made it unless you add that.
Application logs are the lines your code writes while it handles a request: “loading order”, “payment declined”, a caught error with its stack. They explain why. On their own they’re hard to use, because a busy server interleaves lines from hundreds of requests at once. A request ID on every line is what ties them back together.
Request and response capture stores the request itself: headers, body, the response body, and the outbound calls made along the way. It answers “what exactly did this customer send, and what did we send back?”, which is the question behind most bug reports you can’t reproduce. It costs the most, in storage and in care around sensitive data.
A good Node.js setup does all three from one place. The request line from pino-http is your access log. Lines written through the same logger during the request are your application log, tagged with the same request ID. Body capture adds fields to the request line, under a size cap.
Structured JSON logs with pino and pino-http
Use JSON, one object per line. Text formats like GET /orders/1009 200 21ms are nice to read in a terminal and painful to query later. Pino writes newline-delimited JSON by default and is fast enough that logging overhead is rarely the problem. If you’re new to it, our pino guide covers transports and pretty printing, and the log levels post covers which level to use when.
Start with a single logger for the whole process. Every request line and every application line goes through it:
// logger.mjs
import { AsyncLocalStorage } from 'node:async_hooks';
import pino from 'pino';

export const context = new AsyncLocalStorage();

export const logger = pino({
  // Every line logged inside a request picks up its reqId (and userId once auth sets it).
  // Return a copy: pino merges the line's fields into the object you return.
  mixin: () => ({ ...context.getStore() }),
  // A second net for known paths, in case someone logs a raw object.
  redact: {
    paths: ['req.headers.authorization', 'req.headers.cookie', '*.password', '*.token'],
    censor: '[REDACTED]',
  },
});
The comment on mixin is there because we hit it while testing this post. Pino’s mixin result is merged with the fields of each log call, and the default merge writes those fields into the object the mixin returned. If you return the AsyncLocalStorage store itself, every field you log during a request ends up stored in the context and repeats on every later line. Returning a copy avoids that.
Request IDs with AsyncLocalStorage
The context store is what puts reqId on lines written deep inside your code, without passing req through every function. AsyncLocalStorage keeps a value for the lifetime of an async call chain, so anything that runs as part of handling a request sees that request’s store. Our AsyncLocalStorage request ID post goes deeper on edge cases like queues and timers.
Take the ID from an incoming x-request-id header when a gateway or another service already set one, validate it, and generate one otherwise. Send it back in the response so a customer can quote it in a support ticket. If your services already pass W3C traceparent headers, the trace context post shows how to log the trace ID instead.
The request line
Here is the pino-http setup. It runs on Express 5 as written; the same options work on any framework that gives pino-http Node’s req and res:
// app.mjs (logging setup)
import { randomUUID } from 'node:crypto';
import express from 'express';
import pinoHttp from 'pino-http';
import { context, logger } from './logger.mjs';
import { captureResponseBody } from './capture-body.mjs';
import { scrub } from './scrub.mjs';
import './outbound.mjs';

const app = express();
app.use(express.json({ limit: '100kb' }));

const SAFE_ID = /^[\w-]{8,64}$/;

app.use(pinoHttp({
  logger,
  genReqId(req, res) {
    const incoming = req.headers['x-request-id'];
    const id = typeof incoming === 'string' && SAFE_ID.test(incoming) ? incoming : randomUUID();
    res.setHeader('x-request-id', id);
    return id;
  },
  // Log what you will query on, not the whole IncomingMessage.
  serializers: {
    req: (req) => ({ method: req.method, url: req.url, userAgent: req.headers['user-agent'] }),
    res: (res) => ({ statusCode: res.statusCode, bytes: Number(res.headers?.['content-length']) || undefined }),
  },
  customLogLevel: (req, res, err) =>
    err || res.statusCode >= 500 ? 'error' : res.statusCode >= 400 ? 'warn' : 'info',
  customSuccessMessage: (req, res) => `${req.method} ${routeOf(req)} ${res.statusCode}`,
  customErrorMessage: (req, res) => `${req.method} ${routeOf(req)} ${res.statusCode}`,
  // pino-http calls this when the request starts and again when the response
  // finishes. Route, user and bodies are only known at the end.
  customProps: (req, res) => res.writableFinished ? {
    route: routeOf(req),
    requestBody: req.body && scrub(req.body),
    responseBody: res.locals.captureBody?.(),
  } : {},
}));

// Request context for every log line written while handling this request.
app.use((req, res, next) => {
  res.locals.captureBody = captureResponseBody(res);
  context.run({ reqId: req.id }, next);
});

function routeOf(req) {
  return req.route ? req.baseUrl + req.route.path : 'unmatched';
}
The req serializer is an allowlist. pino-http’s default serializer logs every request header, which is how Authorization headers end up in log storage. Logging only the fields you query on is safer than trying to list every header you must remove, and the lines are smaller.
customProps checks res.writableFinished. In our test, pino-http called it once when the request started (its result became part of req.log’s bindings) and again when the response finished. At the start, Express hasn’t matched a route yet, so a route logged there reads unmatched on every line. Computing it only at the end gives you the pattern.
The route comes from req.route.path, which Express sets when a route matches. Requests that match nothing (404s from scanners, mostly) get unmatched, which keeps them in one bucket instead of thousands.
Your auth middleware should add the caller once it knows who they are: context.getStore().userId = user.id. From then on, every line for that request carries it, including the final request line. A real request from our test run, with the API key mapped to cus_42:
{"level":30,"time":1794521940530,"pid":508,"hostname":"vm","req":{"method":"GET","url":"/orders/1009","userAgent":"node"},"route":"/orders/:id","responseBody":{"body":{"id":"1009","total":4200,"stock":{"sku":"1009","inStock":3},"contactEmail":"[EMAIL]"},"bytes":94,"truncated":false},"reqId":"req-from-gateway-001","userId":"cus_42","res":{"statusCode":200,"bytes":94},"responseTime":21,"msg":"GET /orders/:id 200"}
Inside a handler, use req.log or the shared logger. Both pick up reqId and userId. The handler’s req.log.info({ orderId }, 'loading order') produced this line in the same run, with no request ID passed by hand:
{"level":30,"time":1794521923992,"pid":451,"hostname":"vm","req":{"method":"GET","url":"/orders/1009","userAgent":"node"},"reqId":"req-from-gateway-001","userId":"cus_42","orderId":"1009","msg":"loading order"}
Log request and response bodies in Node.js safely
Bodies are where most of the debugging value is, and most of the risk and cost. Four rules keep them manageable.
Cap the size. Keep the first few kilobytes of each body and record the full size next to it. A truncated JSON body is still enough to see which field was wrong in most bug reports. We use 8 KB below; pick a number based on your typical payloads.
Check the content type. Log JSON, form data and text. Record images, archives, PDFs and application/octet-stream as a size only. Compressed responses (with a Content-Encoding header) are bytes you can’t read without decompressing, so skip them too.
Don’t buffer the response. The common shortcut is to collect the body and log it before sending it, which breaks streaming: a CSV export or server-sent events stream would sit in memory until it finished. Copy chunks as they pass through instead.
Redact before the line is written. Covered in the next section.
The request body is the easy half. With express.json({ limit: '100kb' }) in front, req.body is already parsed and size-limited, so scrub(req.body) in customProps is enough. Other frameworks parse bodies differently; the framework guides at the end show where the parsed body lives in each.
The response body needs a wrapper around res.write and res.end. Every way a Node.js framework sends a body (res.json, res.send, stream.pipe(res), Fastify’s reply) ends up calling one of these two methods on the underlying ServerResponse:
// capture-body.mjs
import { scrub } from './scrub.mjs';

const MAX_BODY = 8 * 1024; // bytes kept per body
const TEXT_TYPE = /^(application\/([\w.+-]*json|x-www-form-urlencoded)|text\/)/i;

// Wraps res.write/res.end to keep a copy of the first MAX_BODY bytes.
// Chunks still go to the client as they arrive, so streaming keeps working.
export function captureResponseBody(res) {
  const chunks = [];
  let kept = 0;
  let total = 0;
  const { write, end } = res;

  const keep = (chunk, encoding) => {
    if (chunk == null || typeof chunk === 'function') return;
    const buf = Buffer.isBuffer(chunk)
      ? chunk
      : Buffer.from(chunk, typeof encoding === 'string' ? encoding : 'utf8');
    total += buf.length;
    if (kept < MAX_BODY) {
      const slice = buf.subarray(0, MAX_BODY - kept);
      chunks.push(slice);
      kept += slice.length;
    }
  };

  res.write = function (chunk, encoding, cb) {
    keep(chunk, encoding);
    return write.call(this, chunk, encoding, cb);
  };
  res.end = function (chunk, encoding, cb) {
    keep(chunk, encoding);
    return end.call(this, chunk, encoding, cb);
  };

  // Call once the response has finished.
  return () => {
    const type = String(res.getHeader('content-type') ?? '');
    if (!TEXT_TYPE.test(type)) return { omitted: `non-text body (${type || 'no type'})`, bytes: total };
    if (res.getHeader('content-encoding')) return { omitted: 'compressed body', bytes: total };
    const text = Buffer.concat(chunks).toString('utf8');
    const truncated = total > kept;
    let body = text;
    if (!truncated && /json/i.test(type)) {
      try { body = scrub(JSON.parse(text)); } catch { /* keep the text */ }
    }
    if (typeof body === 'string') body = scrub(body);
    return { body, bytes: total, truncated };
  };
}
The wrapper copies at most 8 KB per response however large the body is, and it passes every chunk straight through. We tested it with a route that pipes a 2,001-line CSV from a Readable stream into the response. The client received all 18,527 bytes, and the log line recorded "bytes":18527,"truncated":true with the first 8,192 bytes kept.
The content type is checked when the response finishes, since some handlers set it late. A truncated JSON body is kept as text (it won’t parse), and the text still goes through scrub.
Redaction: headers, fields and patterns
There are three layers, and you want all of them, because each one misses things the others catch. Our redaction post covers the trade-offs in more depth.
Headers: allowlist. The req serializer above logs the method, URL and user agent and nothing else. If you need more headers, add them by name.
Fields: match on key names. Any key that looks like password, token, secret, apiKey, authorization, cookie, cardNumber, cvv or ssn gets its value replaced, at any depth in the body.
Patterns: match on values. Free text, error messages and fields you didn’t expect still carry card numbers, bearer tokens and email addresses. A few regular expressions catch the common shapes.
// scrub.mjs
const SECRET_KEYS = /pass(word)?|secret|token|api[-_]?key|authorization|cookie|card(number)?|cvv|ssn/i;
const PATTERNS = [
  [/\b(?:\d[ -]?){13,19}\b/g, '[CARD]'],                       // card-like digit runs
  [/\bBearer\s+[A-Za-z0-9._~+/-]+=*/gi, 'Bearer [REDACTED]'],    // bearer tokens in free text
  [/[\w.+-]+@[\w-]+\.[\w.-]+/g, '[EMAIL]'],                      // email addresses
];

export function scrub(value, depth = 0) {
  if (depth > 8) return '[DEPTH]';
  if (typeof value === 'string') return PATTERNS.reduce((s, [re, sub]) => s.replace(re, sub), value);
  if (Array.isArray(value)) return value.map((v) => scrub(v, depth + 1));
  if (value && typeof value === 'object') {
    return Object.fromEntries(Object.entries(value).map(([k, v]) =>
      [k, SECRET_KEYS.test(k) ? '[REDACTED]' : scrub(v, depth + 1)]));
  }
  return value;
}
Pino’s own redact option (in logger.mjs) is the last net. It works on fixed paths and is fast, which makes it right for known shapes like req.headers.authorization and wrong for arbitrary bodies, which is why scrub runs first. A failed login from the test run shows both in action:
{"level":40,"time":1794521940549,"pid":508,"hostname":"vm","req":{"method":"POST","url":"/login","userAgent":"node"},"route":"/login","requestBody":{"email":"[EMAIL]","password":"[REDACTED]"},"responseBody":{"body":{"error":"invalid credentials"},"bytes":31,"truncated":false},"reqId":"ffceb4a3-f7c5-4817-b2bd-56a98dec28c1","res":{"statusCode":401,"bytes":31},"responseTime":0,"msg":"POST /login 401"}
Whether to mask emails is your call. They help support find a customer’s requests and they’re personal data. A common middle ground is to log a user ID and keep emails out.
Beyond the regexes, skip body capture entirely on routes that only handle secrets (password reset, card entry), and add a test that sends a known fake secret through every route and fails if it shows up in captured output.
Node.js HTTP logging for outbound calls and errors
When an endpoint is slow, the cause is often a call your code made: a payment provider, an auth service, a model API. Those calls need lines too, with the same request ID.
Node’s built-in fetch is undici, which publishes diagnostics channel events for every request. Subscribing to them logs every fetch call in the process, including ones made inside SDKs, without wrapping anything:
// outbound.mjs: log every fetch() call the process makes
import diagnostics_channel from 'node:diagnostics_channel';
import { context, logger } from './logger.mjs';

const pending = new WeakMap();

diagnostics_channel.subscribe('undici:request:create', ({ request }) => {
  // Runs synchronously inside fetch(), so the request context is still here.
  pending.set(request, { start: performance.now(), ctx: context.getStore() });
});

diagnostics_channel.subscribe('undici:request:headers', ({ request, response }) => {
  const p = pending.get(request);
  if (!p) return;
  logger.info({
    ...p.ctx,
    outbound: {
      method: request.method,
      origin: request.origin,
      path: request.path.split('?')[0],
      status: response.statusCode,
      ms: Math.round(performance.now() - p.start),
    },
  }, 'outbound request');
});

diagnostics_channel.subscribe('undici:request:error', ({ request, error }) => {
  const p = pending.get(request);
  logger.warn({
    ...p?.ctx,
    outbound: { method: request.method, origin: request.origin, path: request.path.split('?')[0] },
    err: { code: error.code, message: error.message },
  }, 'outbound request failed');
});
The request context is captured in create, which runs inside the fetch() call, and carried in the WeakMap to the later events. The query string is dropped because outbound URLs often carry API keys. The line from the test run sits next to the inbound request it belongs to:
{"reqId":"req-from-gateway-001","outbound":{"method":"GET","origin":"http://127.0.0.1:38677","path":"/stock/1009","status":200,"ms":8}}
That covers fetch. Clients built on http.request (axios, got, many older SDKs) need a different hook; the outbound HTTP logging post covers both, and the fetch timeouts post covers what to log when a call hangs.
For errors, log the error object under err so pino’s error serializer records the type, message and stack, and let the error handler set the status code before pino-http writes the request line. The Express error handling post has a full error middleware that does this. With customLogLevel above, every 5xx is an error line and every 4xx is a warn, so you can alert on the first and graph the second.
Retention and cost
Logging cost is mostly arithmetic. A request line from the setup above is a few hundred bytes (the /reports/slow line in our test run was 279). Add 8 KB of captured bodies and it can grow 20 times or more. At one million requests a day:
| What you keep | Approx. size per request | Per day | Per 30 days |
|---|---|---|---|
| Request line only | 400 B | 0.4 GB | 12 GB |
| Line plus bodies (avg. 4 KB) | 4.4 KB | 4.4 GB | 132 GB |
Those are our example sizes, not measurements of your API; check your own by running wc -c on an hour of logs. The point is the ratio: bodies dominate.
So keep them separately. Request lines are cheap and useful for months (trends, audits, “when did this start?”). Bodies are expensive and mostly useful for days, while a bug report is fresh. A sensible starting point is 30 to 90 days for lines and 7 to 14 for bodies, or bodies only on errors and on the routes support asks about most. Our log retention post works through retention rules and what different compliance regimes ask for.
If your log platform charges by ingested volume, also consider which levels you ship. Debug lines from a busy service can outweigh the request lines.
Making logs answer questions
These three queries cover most of what support and on-call ask, and they run as-is with jq on the newline-delimited JSON from the setup above. The output shown is from our test run on Node 24. On a log platform the same filters are a few clicks.
A customer says “your API failed for me around 3pm”. Find their requests:
jq -c 'select(.userId == "cus_42" and .res) | {time: (.time/1000|todate), reqId, route, status: .res.statusCode, ms: .responseTime}' app.log
{"time":"2026-11-12T22:19:00Z","reqId":"req-from-gateway-001","route":"/orders/:id","status":200,"ms":21}
Then pull every line for the request ID they quote, outbound calls included: jq -c 'select(.reqId == "req-from-gateway-001")' app.log.
A spike of 401s. Group by route and see when it started:
jq -s -c 'map(select(.res.statusCode == 401)) | group_by(.route) | map({route: .[0].route, count: length, firstSeen: (map(.time) | min / 1000 | todate)})' app.log
[{"route":"/login","count":3,"firstSeen":"2026-11-12T22:19:00Z"}]
A steady stream of 401s on /login from a handful of sources is a common sign of credential stuffing; the credential stuffing post and the 401 vs 403 post cover how to tell the patterns apart. Adding the client IP or API key fingerprint to the request line is what makes that split possible.
An endpoint feels slow. Rank routes by p95 latency:
jq -s -c 'map(select(.res)) | group_by(.route) | map({route: .[0].route, n: length, p95: (map(.responseTime) | sort | .[(length * 0.95 | floor)])}) | sort_by(-.p95)' app.log
[{"route":"/reports/slow","n":6,"p95":559},{"route":"/orders/:id","n":1,"p95":21},{"route":"/export.csv","n":1,"p95":20},{"route":"unmatched","n":1,"p95":3},{"route":"/login","n":3,"p95":2}]
This only works because route is the pattern. Group by raw URL and /orders/1009 and /orders/1010 are different rows. With six samples the p95 is just the slowest request; on real traffic, our percentiles post explains which percentile to watch. For a slow route, the outbound lines with the same reqId usually show where the time went.
jq works for one server and one day of logs. Across several instances, or for anything older, you need the logs in one searchable place.
Node.js request logging tools compared
| Option | What it is | Good at | What you add yourself |
|---|---|---|---|
| morgan | HTTP request logger middleware from the Express project | Simple access logs in Apache-style or custom text formats, zero setup | Structured output, request IDs, bodies, storage and search |
| pino / pino-http | Fast JSON logger plus HTTP middleware | Structured request and application logs with low overhead, redaction paths | Body capture, outbound logging, storage and search |
| winston (with express-winston) | Flexible logger with many transports | Many output destinations and formats | Same as pino; more configuration |
| ELK (Elasticsearch, Logstash, Kibana) or OpenSearch | Self-hosted log storage and search | Full-text search and dashboards over any log | Running and sizing the cluster, retention, shipping |
| Grafana Loki | Log storage that indexes labels, not full log lines | Cheap storage for large volumes, pairs with Grafana | Choosing labels carefully; queries filter line content at read time |
| Moesif | Hosted API analytics with usage-based billing | Per-customer API usage analytics and monetization for API products | Application logs, framework setup per their SDK |
| ApiTraffic | Hosted request capture with APM and a firewall for Node.js APIs | Searchable requests with bodies, outbound calls and redaction rules set in a dashboard | Your own application log lines stay in your logger |
Most teams combine two rows: a logger (pino or winston) for application lines, plus somewhere to store and search them. Request capture is a separate decision, and depends on how often “what exactly did they send?” comes up.
Logging guides for each Node.js framework
The pieces above (request ID, route pattern, body capture, redaction) sit in a different place in each framework. These guides cover the framework-specific parts:
- Express logging with pino-http or morgan, and Express monitoring for route metrics
- Fastify logging, which ships with pino built in, plus Fastify hooks for logging and auth
- NestJS logging with the built-in Logger or nestjs-pino
- Koa monitoring and logging
- hapi monitoring and logging with hapi-pino
- AdonisJS monitoring and logging
- Strapi monitoring and logging
For metrics, latency and alerting across the same frameworks, see the Node.js API monitoring guide.
Doing this with ApiTraffic
Everything above is code you write and maintain. ApiTraffic does the request capture part from one package, @apitraffic/node, registered before your routes:
const express = require('express');
const apitraffic = require('@apitraffic/node');

const app = express();
app.use(express.json());          // body parsers first
app.use(apitraffic.express());    // then ApiTraffic, before your routes
It supports Express 4.17+ and 5, Fastify 4 and 5, Koa 2.13+ and 3 and hapi 21 on Node.js 20 or later, with separate packages for NestJS, AdonisJS, LoopBack, Sails and Meteor (install guide). Each request is recorded with its headers, bodies and timing, plus the outbound calls it made through http, https or fetch (outbound requests).
Redaction rules are set in the dashboard, by key or by value pattern, for headers, query strings and bodies, and pushed to every connected server without a deploy. The SDK sends nothing until the rules have loaded (redaction docs). The customer ID from the queries above is one call, apitraffic.tag('customerId', String(req.user.id)), and then searchable with filters like tag:customerId == "cus_42" AND status_code >= 500 (search syntax).
Keep pino for your application lines. ApiTraffic covers the request, body and outbound record, and how long bodies are kept depends on your plan. See what’s hitting your API: apitraffic.io
FAQ
How do I log every request in Node.js?
Add request logging middleware before your routes. With pino-http, app.use(pinoHttp({ logger })) writes one JSON line per request when the response finishes, with method, URL, status and duration. Add a route pattern, request ID and user ID as shown above so the lines can answer questions.
How do I log the request and response body in Node.js?
For the request body, log the parsed req.body after your body parser, through a redaction function. For the response body, wrap res.write and res.end to copy the first few kilobytes as they’re sent, so streaming responses still work. Skip binary and compressed bodies and cap the size.
What should you not log in an API?
Passwords, access tokens, API keys, session IDs, Authorization and Cookie headers, payment card data, and personal data with no reason to be there. The OWASP Logging Cheat Sheet lists these. Use a header allowlist, key-based redaction and value patterns together, and test that a known fake secret never reaches your logs.
What is the best logger for Node.js APIs?
Pino is the usual choice for APIs: it writes structured JSON, has low overhead, and pino-http adds request logging with request IDs. Winston has more transports and formats. Morgan is fine for plain access logs but writes text, so you’ll want a JSON logger alongside it.
Does logging slow down a Node.js API?
A JSON request line per request is a small cost with pino. Body capture costs more because it copies and processes data, which is why the examples cap each body at 8 KB and skip binary types. Writing logs synchronously to a slow destination is the common way logging hurts latency, so write to stdout and ship logs from outside the process.
Keep reading
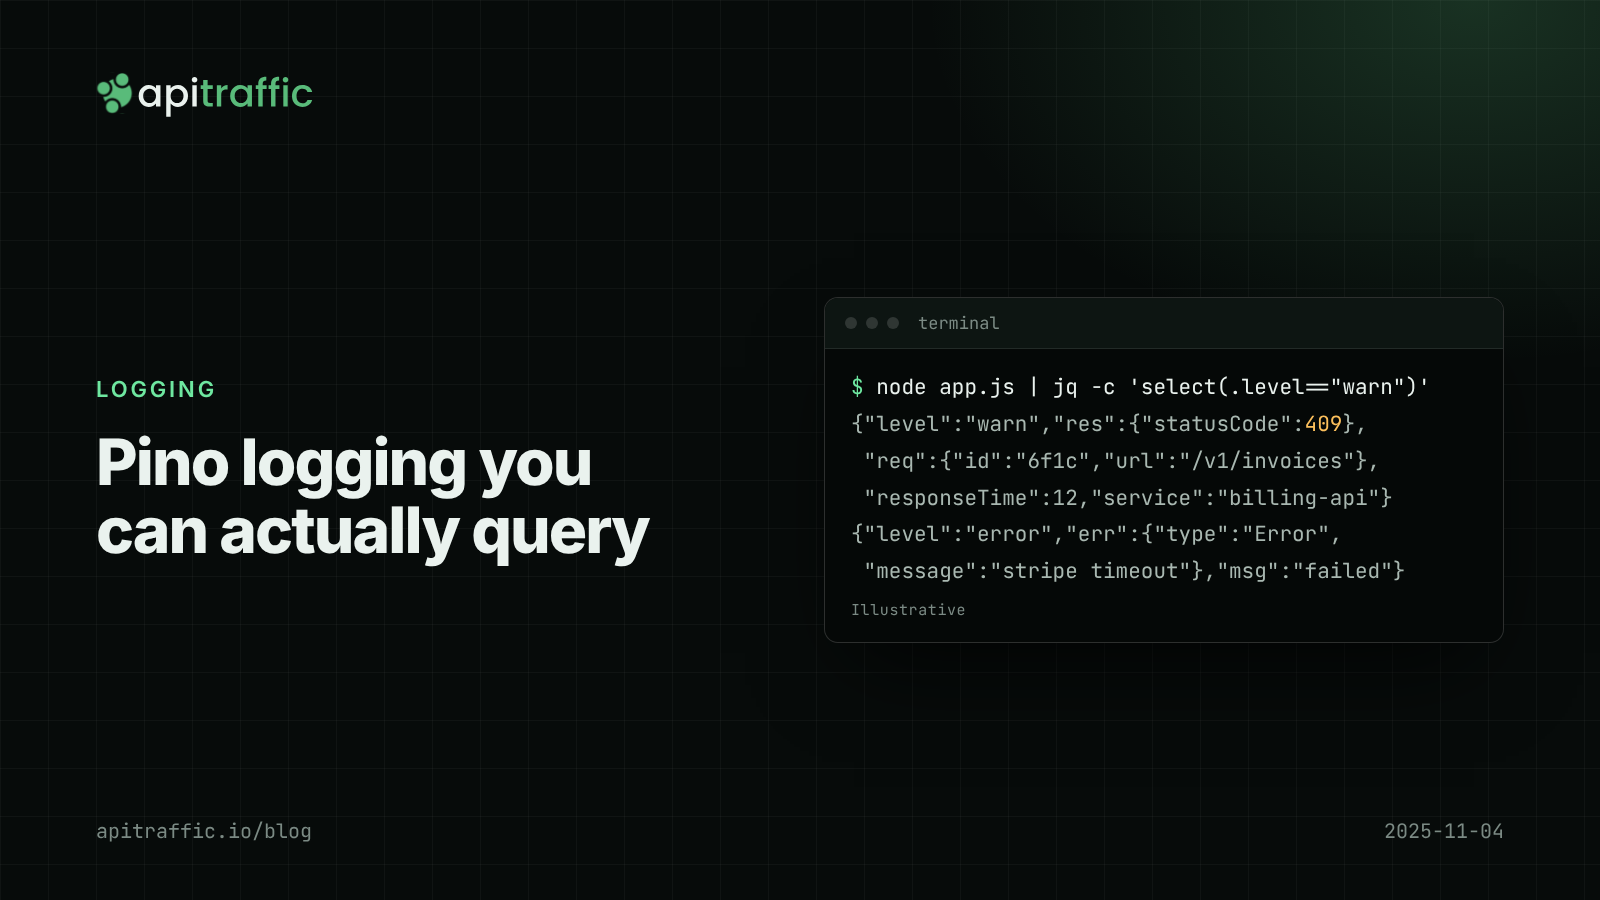
Pino logging in Node.js: a practical structured logging setup for Express and Fastify
A customer says invoices failed yesterday and your logs are a wall of console.log. Set up Pino logging for Express or Fastify in an afternoon: JSON lines, request IDs, levels by status, redaction and a team checklist.
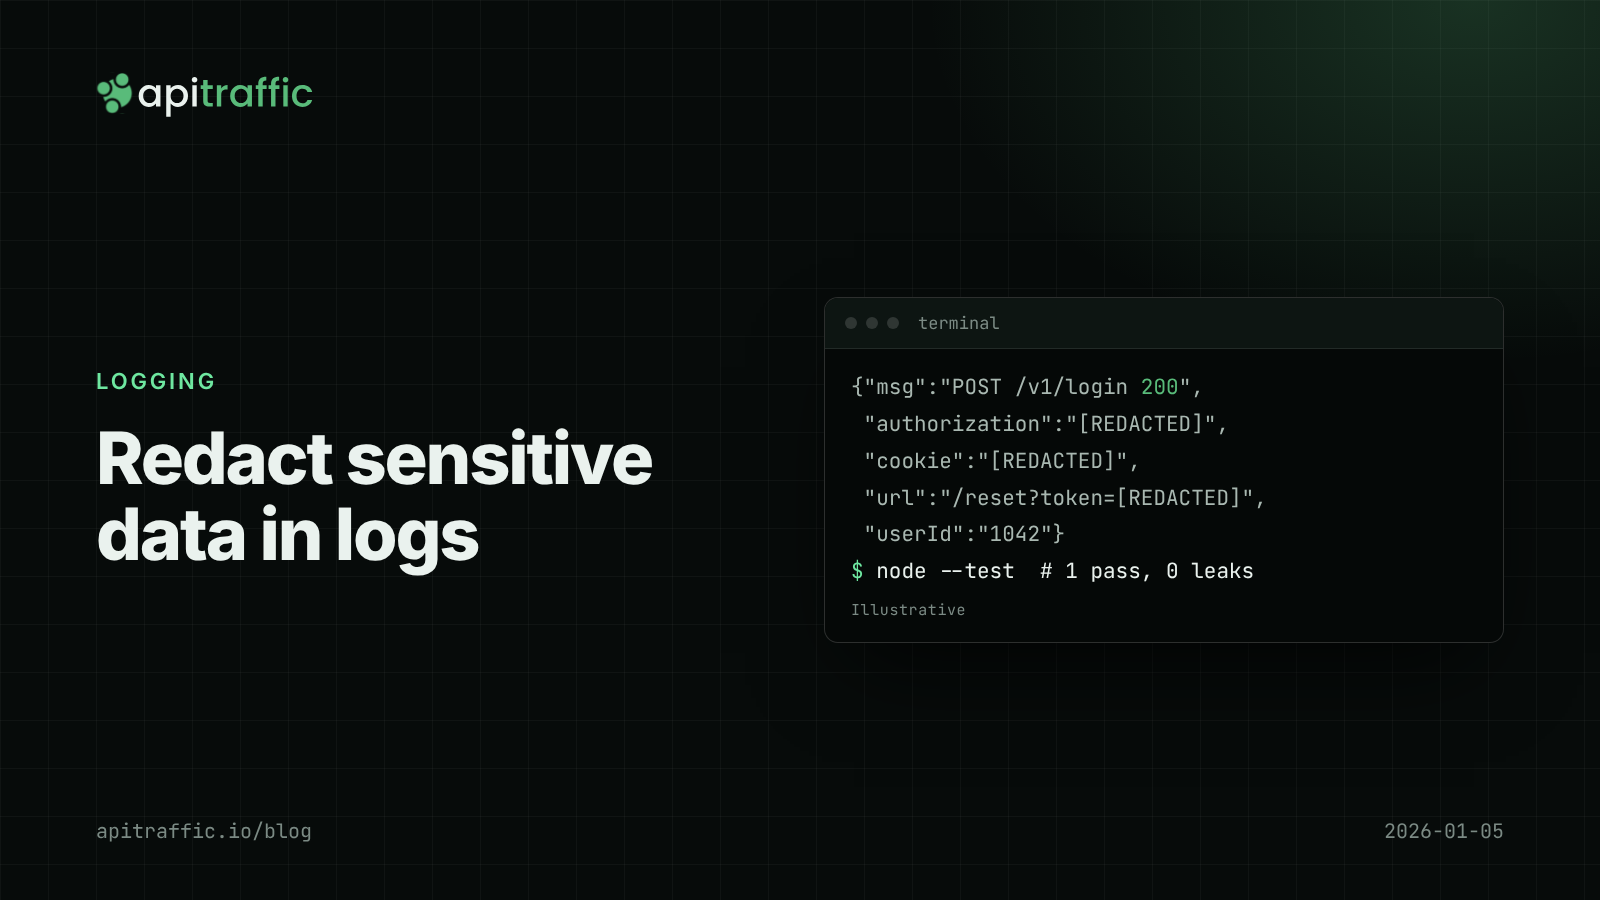
How to redact sensitive data in logs for Node.js APIs
Found a bearer token in your logs? Here's how to keep secrets and personal data out of Node API logs in an afternoon: Pino redaction, URL and error scrubbing, body allowlists and a test that catches leaks.
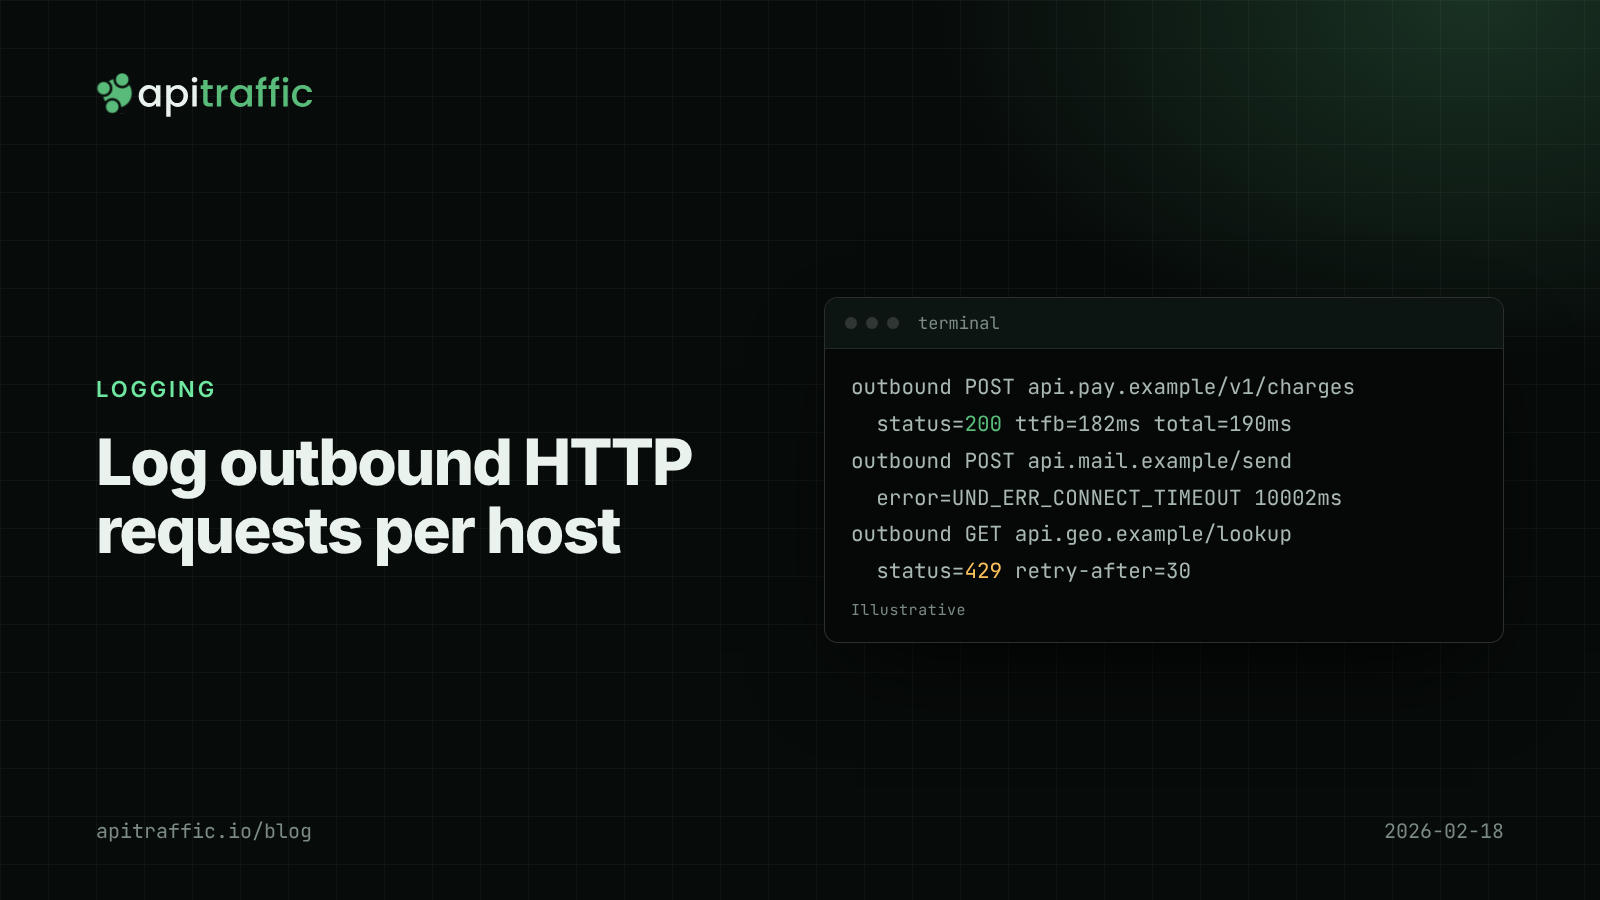
How to log outbound HTTP requests in Node.js
Your API threw 502s because a provider was timing out, and your logs said nothing. Log outbound HTTP requests from fetch and axios with diagnostics_channel in an afternoon, then read error rate and p95 per host.