
Express monitoring: route-level metrics, APM and alerts for Express 4 and 5
Record the route pattern, trace inside the request, and alert on p95 and 5xx. Tested on Express 4 and 5.

Express monitoring comes down to four things: request rate, error rate and latency for each route pattern (not each URL), traces that show where time goes inside a slow request, saturation signals from the Node process (event loop delay, heap, connection pools), and a few alerts tied to what users feel. The fastest working setup is one middleware that records route, status and duration into a Prometheus histogram, plus OpenTelemetry preloaded with node -r so Express, HTTP and database calls get spans. Both are below, with code we ran on Express 4.22.3 and 5.3.0 under Node 22.
This guide is part of our Node.js API monitoring guide. If you also need request logs, see the Node.js API logging guide.
Three Express traps that break your metrics
Most Express monitoring tutorials label metrics with req.path or req.originalUrl. That gives you a separate time series for /v1/orders/123, /v1/orders/456 and every other id, which is useless on a dashboard and expensive in Prometheus. You want the route pattern, /v1/orders/:orderId.
The catch is that Express only knows the pattern after routing. req.route is undefined while your monitoring middleware runs, because no route has matched yet. Read it later, when the response finishes, and combine it with req.baseUrl so routers mounted with app.use('/v1/orders', router) keep their prefix.
Second trap: Express 5 changed path syntax. A bare * wildcard is gone (on 5.3.0, registering /old/* throws Missing parameter name at startup); wildcards need a name (/*splat) and optional segments use braces (/:file{.:ext}). We checked that the middleware below labels those routes as /assets/*splat and /files/:file{.:ext}. Your route labels change with the syntax, so dashboards and alert rules that match on old patterns need updating when you upgrade. The Express 5 migration guide covers the full list.
Third trap: async errors on Express 4. A rejected promise in an async handler never reaches Express 4’s error middleware. In our test on Express 4.22.3, an async handler that threw took the whole process down on Node 22, so the 500 never showed up in any metric. Express 5 forwards rejected promises to your error handler automatically. If you’re still on 4, wrap async handlers or upgrade; Express error handling in production walks through both.
Build route-level metrics for Express with prom-client
prom-client is the standard Prometheus client for Node. The middleware below records one histogram, http_server_request_duration_seconds, labelled by method, route pattern and status code. Install it with npm install prom-client (we used 15.1.3).
// metrics.js
const client = require('prom-client');

const register = new client.Registry();
client.collectDefaultMetrics({ register }); // heap, GC, event loop lag, handles

const httpDuration = new client.Histogram({
  name: 'http_server_request_duration_seconds',
  help: 'Express request duration by route, method and status',
  labelNames: ['method', 'route', 'status_code'],
  buckets: [0.01, 0.025, 0.05, 0.1, 0.25, 0.5, 1, 2.5, 5, 10],
  registers: [register],
});

function routeLabel(req) {
  // req.route is only set once a route matched. Unmatched requests
  // (404s, scanners) share one label so they can't blow up cardinality.
  if (!req.route) return 'unmatched';
  const path = Array.isArray(req.route.path) ? req.route.path.join('|') : String(req.route.path);
  const route = (req.baseUrl || '') + path;
  return route.length > 1 ? route.replace(/\/$/, '') : route;
}

function metricsMiddleware(req, res, next) {
  const end = httpDuration.startTimer();
  res.on('finish', () => {
    end({ method: req.method, route: routeLabel(req), status_code: res.statusCode });
  });
  next();
}

module.exports = { register, metricsMiddleware };
Mount it first so it times everything after it, and expose /metrics behind a token or on a private port. A public /metrics endpoint shows anyone your route list and traffic volume.
// server.js
const express = require('express');
const { register, metricsMiddleware } = require('./metrics');

const app = express();
app.use(metricsMiddleware); // first, so it times everything below it
app.use(express.json());

const orders = express.Router();
orders.get('/:orderId', (req, res) => res.json({ id: req.params.orderId }));
orders.post('/', (req, res) => res.status(201).json({ ok: true }));
app.use('/v1/orders', orders);

app.get('/v1/fail', (req, res, next) => {
  next(new Error('boom'));
});

// /metrics: keep it off the public internet
app.get('/metrics', async (req, res) => {
  if (req.get('authorization') !== `Bearer ${process.env.METRICS_TOKEN}`) {
    return res.sendStatus(401);
  }
  res.set('Content-Type', register.contentType);
  res.send(await register.metrics());
});

app.use((err, req, res, next) => {
  res.status(500).json({ error: 'internal' });
});

app.listen(3000);
We sent two order lookups, one POST, a request for /.env, one failing request and one /metrics call without a token. Here is the histogram’s count series, identical on Express 4.22.3 and 5.3.0:
http_server_request_duration_seconds_count{method="GET",route="/v1/orders/:orderId",status_code="200"} 2
http_server_request_duration_seconds_count{method="POST",route="/v1/orders",status_code="201"} 1
http_server_request_duration_seconds_count{method="GET",route="unmatched",status_code="404"} 1
http_server_request_duration_seconds_count{method="GET",route="/v1/fail",status_code="500"} 1
http_server_request_duration_seconds_count{method="GET",route="/metrics",status_code="401"} 1
Both order ids land in one series. The /.env probe goes to unmatched instead of creating a new label value, which matters once scanners start walking your API. The trailing-slash trim turns the router’s / into /v1/orders.
A few details in that code:
- The buckets above cover 10 ms to 10 s. If your API answers most requests under 50 ms, add finer buckets at the low end; percentiles computed from a histogram are only as precise as the bucket edges around them.
- Status code is a safe label because there are only a few dozen of them. Don’t add user ids, tenant ids or raw paths as labels.
finishdoesn’t fire when a client disconnects before the response is sent. If you need those requests counted, listen forclosetoo and record them with a separate label.
Express APM: trace inside the request with OpenTelemetry
Metrics tell you /v1/orders/:orderId got slow. A trace tells you it was the third Postgres query, or an outbound call to a payment API. For Express, the open standard is OpenTelemetry with its Node auto-instrumentations, which patch http, express, pg, redis, mongodb and many more.
npm install @opentelemetry/api @opentelemetry/sdk-node @opentelemetry/auto-instrumentations-node
// instrumentation.js: must run before express, pg or anything else is required
const { NodeSDK } = require('@opentelemetry/sdk-node');
const { getNodeAutoInstrumentations } = require('@opentelemetry/auto-instrumentations-node');

const sdk = new NodeSDK({
  serviceName: 'orders-api',
  instrumentations: [
    getNodeAutoInstrumentations({
      '@opentelemetry/instrumentation-fs': { enabled: false }, // noisy
    }),
  ],
});
sdk.start();

process.on('SIGTERM', () => sdk.shutdown().finally(() => process.exit(0)));
Start the app with the file preloaded:
node -r ./instrumentation.js server.js
For ES modules, use --import with an ESM version of the file. Set OTEL_EXPORTER_OTLP_ENDPOINT to send spans to a collector or backend, or OTEL_TRACES_EXPORTER=console to print them while testing.
Instrumentation works by patching modules as they are required, and the OpenTelemetry SDK README says to initialize it before any other module loads. We ran the same app two ways on Express 5.3.0 with @opentelemetry/sdk-node 0.301.2 and auto-instrumentations-node 0.83.1, using the console exporter.
Preloaded with -r, one request to /v1/orders/123 produced middleware spans for metricsMiddleware and jsonParser, a router span, and this server span:
name: 'GET /v1/orders/:orderId',
  'http.route': '/v1/orders/:orderId'
With require('express') on the line above require('./instrumentation'), the same request produced a single HTTP span named GET, no route, and zero Express spans. Nothing logged an error, so the first sign would be traces in your backend with no route and no Express detail.
Auto-instrumentation adds overhead per span, so sample in production (OTEL_TRACES_SAMPLER=parentbased_traceidratio with OTEL_TRACES_SAMPLER_ARG=0.1 keeps 10% of traces). And keep the Prometheus histogram even with tracing on: sampled traces are good for finding why, but the histogram counts every request, which is what alerts need.
Saturation: event loop, heap and connection pools
When every route gets slow at the same time, the cause is usually in the process or a shared resource, and these metrics show which.
collectDefaultMetrics() already exports the Node process metrics that matter most:
nodejs_eventloop_lag_p99_seconds: how late timers fire. When synchronous work (a bigJSON.parse, a regex, sync crypto) blocks the loop, every in-flight request waits. Our event loop lag guide covers how to find the blocking code.nodejs_heap_size_used_bytesandnodejs_gc_duration_seconds: steady growth in heap after GC points to a leak; long GC pauses show up as latency spikes across all routes.process_resident_memory_bytes: what your container’s memory limit compares against.
Connection pools need a gauge of their own. With node-postgres, the Pool object exposes totalCount, idleCount and waitingCount. A collect() callback reads them each time Prometheus scrapes:
const { Pool } = require('pg');
const client = require('prom-client');
const { register } = require('./metrics');

const pool = new Pool({ max: 10 });

new client.Gauge({
  name: 'pg_pool_clients',
  help: 'node-postgres pool clients by state',
  labelNames: ['state'],
  registers: [register],
  collect() {
    this.set({ state: 'total' }, pool.totalCount);
    this.set({ state: 'idle' }, pool.idleCount);
    this.set({ state: 'waiting' }, pool.waitingCount); // queries queued for a client
  },
});
waiting above zero for more than a few seconds means requests are queuing for a database connection. Latency on database routes will climb while the database itself looks idle.
Alerts for Express performance monitoring
Alert on what users feel and on the few causes that need a human. These Prometheus rules use the metrics above; tune the thresholds to your own baseline before turning on paging.
groups:
  - name: express-api
    rules:
      - alert: RouteP95Slow
        expr: |
          histogram_quantile(0.95,
            sum by (le, route) (rate(http_server_request_duration_seconds_bucket{route!="unmatched"}[5m]))
          ) > 0.5
        for: 10m
      - alert: Route5xxRateHigh
        expr: |
          sum by (route) (rate(http_server_request_duration_seconds_count{status_code=~"5.."}[5m]))
            / sum by (route) (rate(http_server_request_duration_seconds_count[5m])) > 0.02
        for: 5m
      - alert: EventLoopLagHigh
        expr: nodejs_eventloop_lag_p99_seconds > 0.1
        for: 5m
      - alert: PgPoolQueueing
        expr: pg_pool_clients{state="waiting"} > 0
        for: 2m
The p95 rule fires when a route’s 95th percentile stays over 500 ms for 10 minutes. The 5xx rule fires when more than 2% of a route’s requests fail. Low-traffic routes make ratio alerts noisy, so add a minimum request rate to the 5xx rule if a route gets a handful of calls an hour.
For anything you’d page on, an error budget is calmer than a raw threshold. A 99.5% success target over 30 days allows 0.5% failures, about 3.6 hours of full outage or a longer stretch of partial errors. Alert when you’re burning that budget fast, not on every blip. Error budgets for a small API team and API alerting best practices go further, and our percentile explainer covers why p95 and p99 beat averages.
Express monitoring tools compared
Which of these fits depends mostly on how much you want to run yourself.
| Option | What it’s good at | Setup effort | Good fit for |
|---|---|---|---|
| express-status-monitor | A live in-app dashboard of CPU, memory, response time and status codes | One middleware | Local development and small internal apps; last npm release 1.3.4 (Feb 2022), no history or alerts |
| prom-client + Prometheus + Grafana | Route-level RED metrics, saturation, alerting, long retention, no per-host fees | Medium: you run Prometheus and Grafana or use a hosted version | Teams already on Prometheus, or anyone who wants full control |
| OpenTelemetry + a backend (Jaeger, Grafana Tempo, Honeycomb and others) | Distributed traces across services, vendor-neutral instrumentation | Medium to high: SDK, collector, sampling, a backend | Several services, or a plan to switch backends later |
| Sentry | Errors with stack traces and release tracking, plus performance tracing | Low: an instrument file loaded first, an error handler | Teams whose first question is “what threw and where” |
| APM vendors (Datadog, New Relic, AppSignal and others) | Traces, metrics, logs, infrastructure and alerting in one hosted product | Low to medium: an agent or SDK | Teams who want one hosted product across many services and languages |
| ApiTraffic | Every request and response logged per endpoint, with APM spans and a firewall in the same SDK | Low: one middleware, optional APM preload | Node teams who want the request itself next to its timings, and bot or attack traffic in the same view |
These combine. A common small-team setup is prom-client for metrics and alerts, plus one hosted tool for traces or errors.
Doing this with ApiTraffic
ApiTraffic records every request your Express app serves, groups it by the route Express matched (including router mount paths, so router.get('/:orderId') under /v1/orders becomes /v1/orders/{orderId}), and shows p50, p95 and p99, error counts and status classes per endpoint. It supports Express 4.17 or later and Express 5 on Node.js 20 or later. Setup is one middleware after your body parsers and before your routes:
const express = require('express');
const apitraffic = require('@apitraffic/node');

const app = express();
app.use(express.json());       // body parsers first, so the firewall can inspect bodies
app.use(apitraffic.express()); // then ApiTraffic, before your routes
It reads API_TRAFFIC_TOKEN and API_TRAFFIC_BUCKET from the environment. For APM spans (database queries, cache calls, outbound requests per endpoint), install @apitraffic/apm and start with the same kind of preload as above: node -r @apitraffic/node/register ./server.js. The Express integration docs cover ES modules, error handlers and the firewall.
FAQ
How do I monitor an Express app in production?
Record request rate, error rate and duration per route pattern with a middleware and prom-client, export Node process metrics with collectDefaultMetrics(), and add OpenTelemetry tracing preloaded with node -r. Then alert on p95 latency, 5xx rate and event loop lag per route. A hosted APM or API monitoring tool can replace some or all of that if you’d rather not run Prometheus.
What is the best APM for Express?
It depends on your stack. OpenTelemetry is the vendor-neutral choice and works with many backends; Datadog, New Relic, AppSignal and Sentry all support Express with an agent or SDK. Check that the tool’s Express instrumentation supports your major version, especially if you’ve moved to Express 5.
Why does my Express metrics middleware show the raw URL instead of the route?
Because req.route isn’t set until a route matches, and middleware runs before that. Read req.baseUrl + req.route.path inside a res.on('finish') handler instead of at the start of the request, and give unmatched requests a fixed label.
Does Express 5 change how monitoring works?
Two things change. Async errors now reach your error handler, so failures that used to crash an Express 4 process show up as 500s in your metrics. And path syntax changed (named wildcards, braces for optional segments), so route labels in dashboards and alerts may need updating after the upgrade.
How much overhead does Express monitoring add?
A histogram observation per request is cheap compared with a database round trip. Tracing costs more because every span is recorded and exported, so sample traces in production and keep full counts in metrics. Measure on your own app: compare p95 latency with instrumentation on and off under the same load.
See what’s hitting your API: apitraffic.io
Keep reading
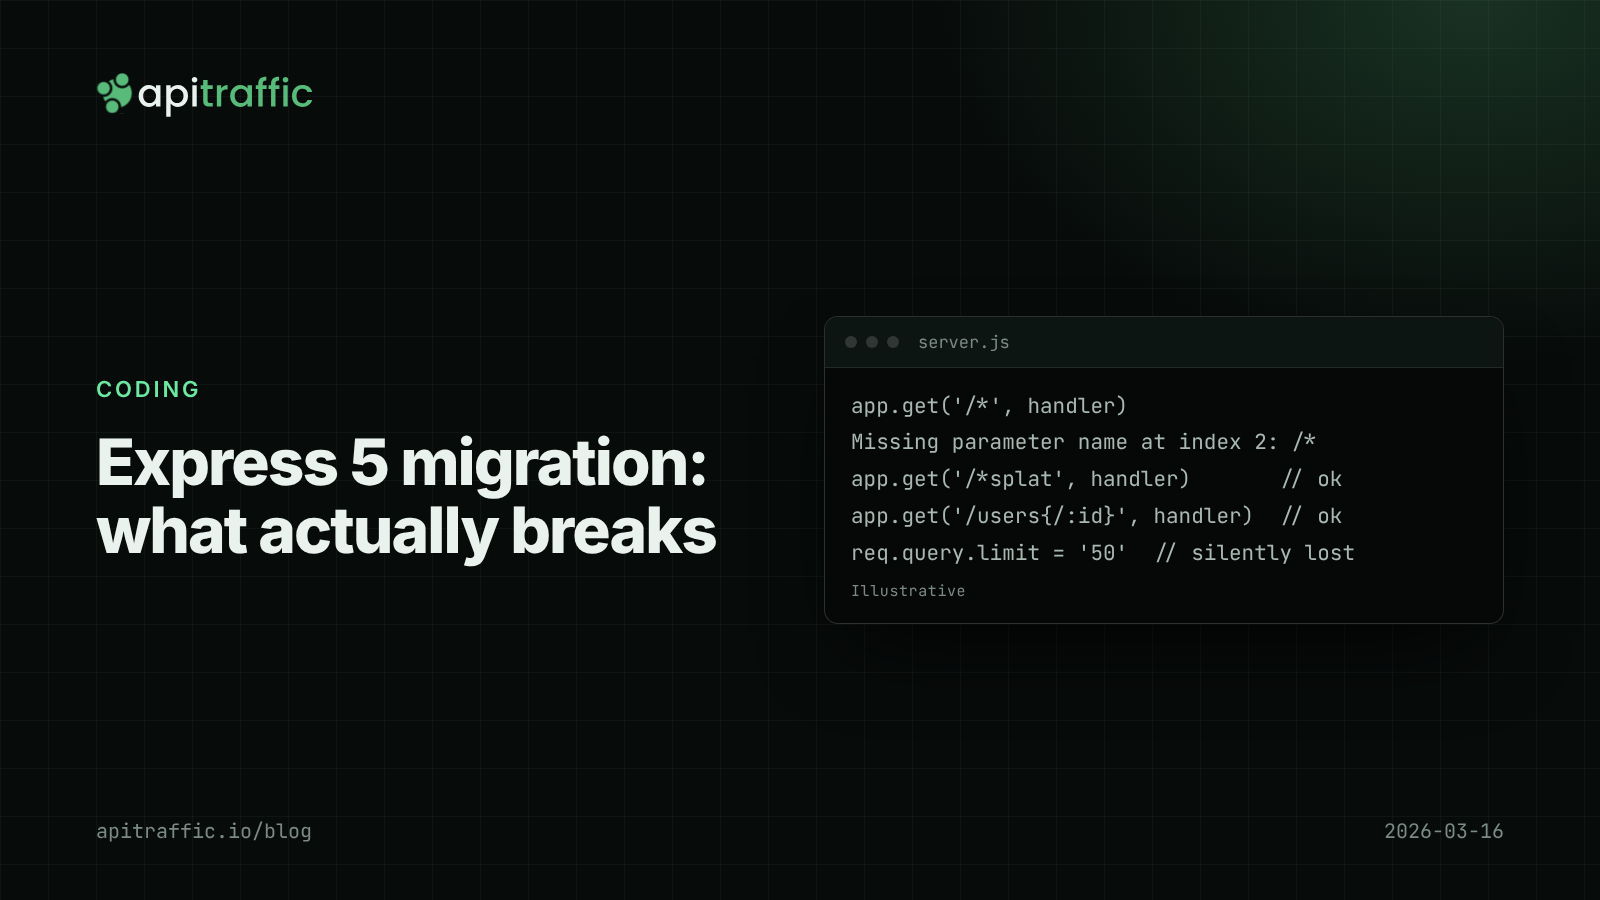
Express 5 migration: what breaks in your API and how to fix it
You bump Express to 5 and the app dies with "Missing parameter name", or worse, starts fine and quietly breaks pagination. Here is what the Express 5 migration actually breaks in an API and how to fix each one.
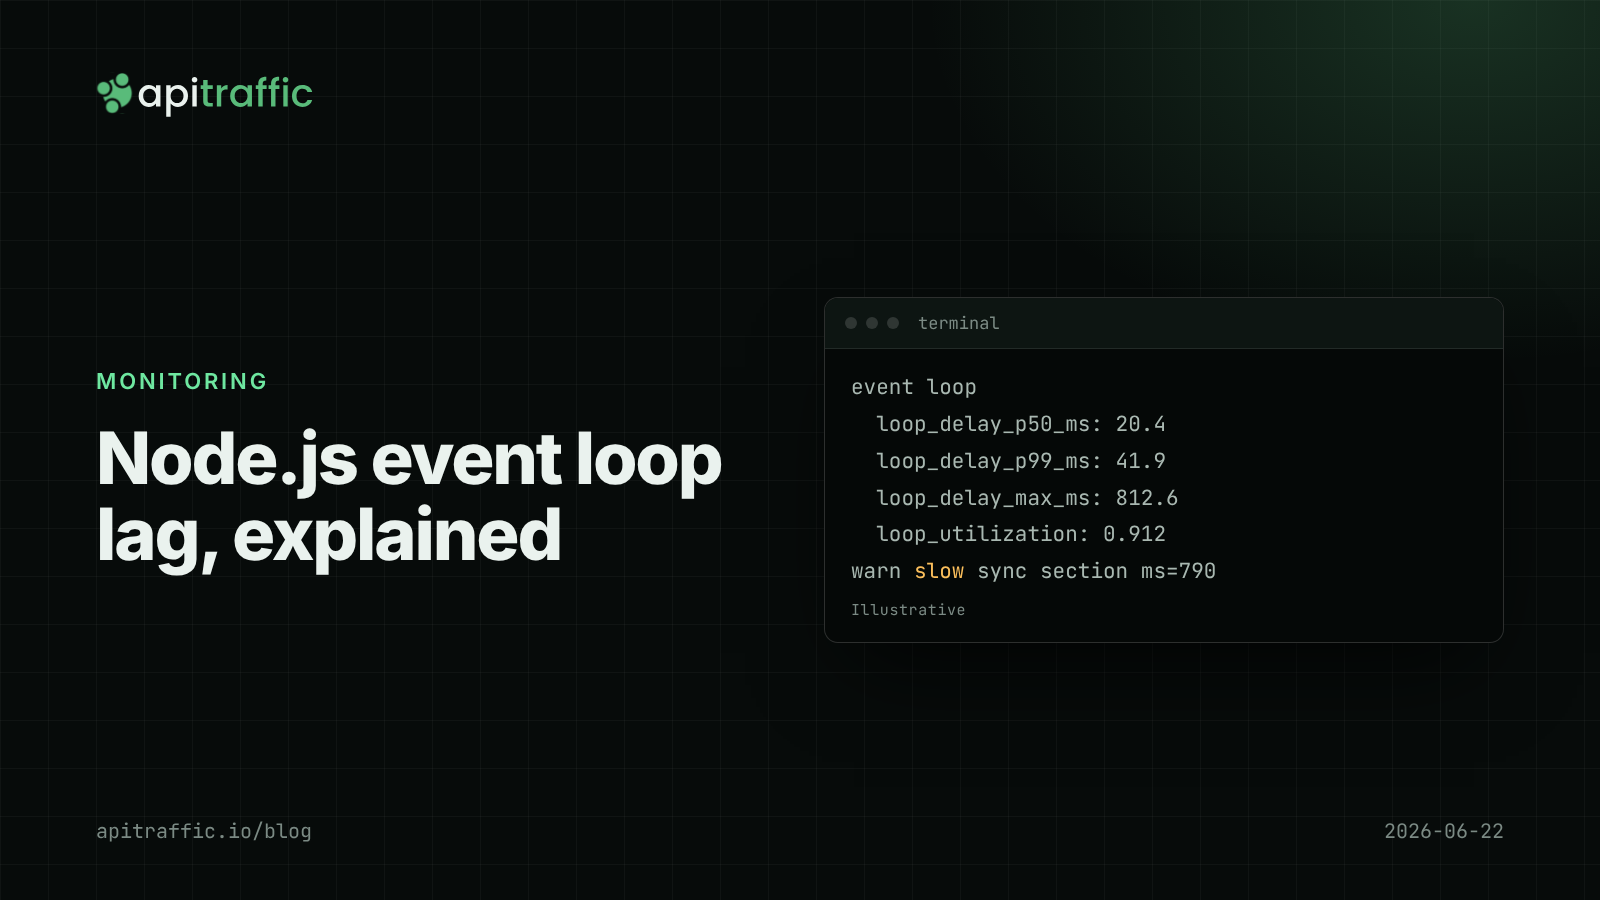
Node.js event loop lag: the metric that explains "random" slowness
Every endpoint slow at once, database fine, CPU looks idle: that is event loop lag. Here is how to measure it in Node with built-in tools and find the code that blocks.
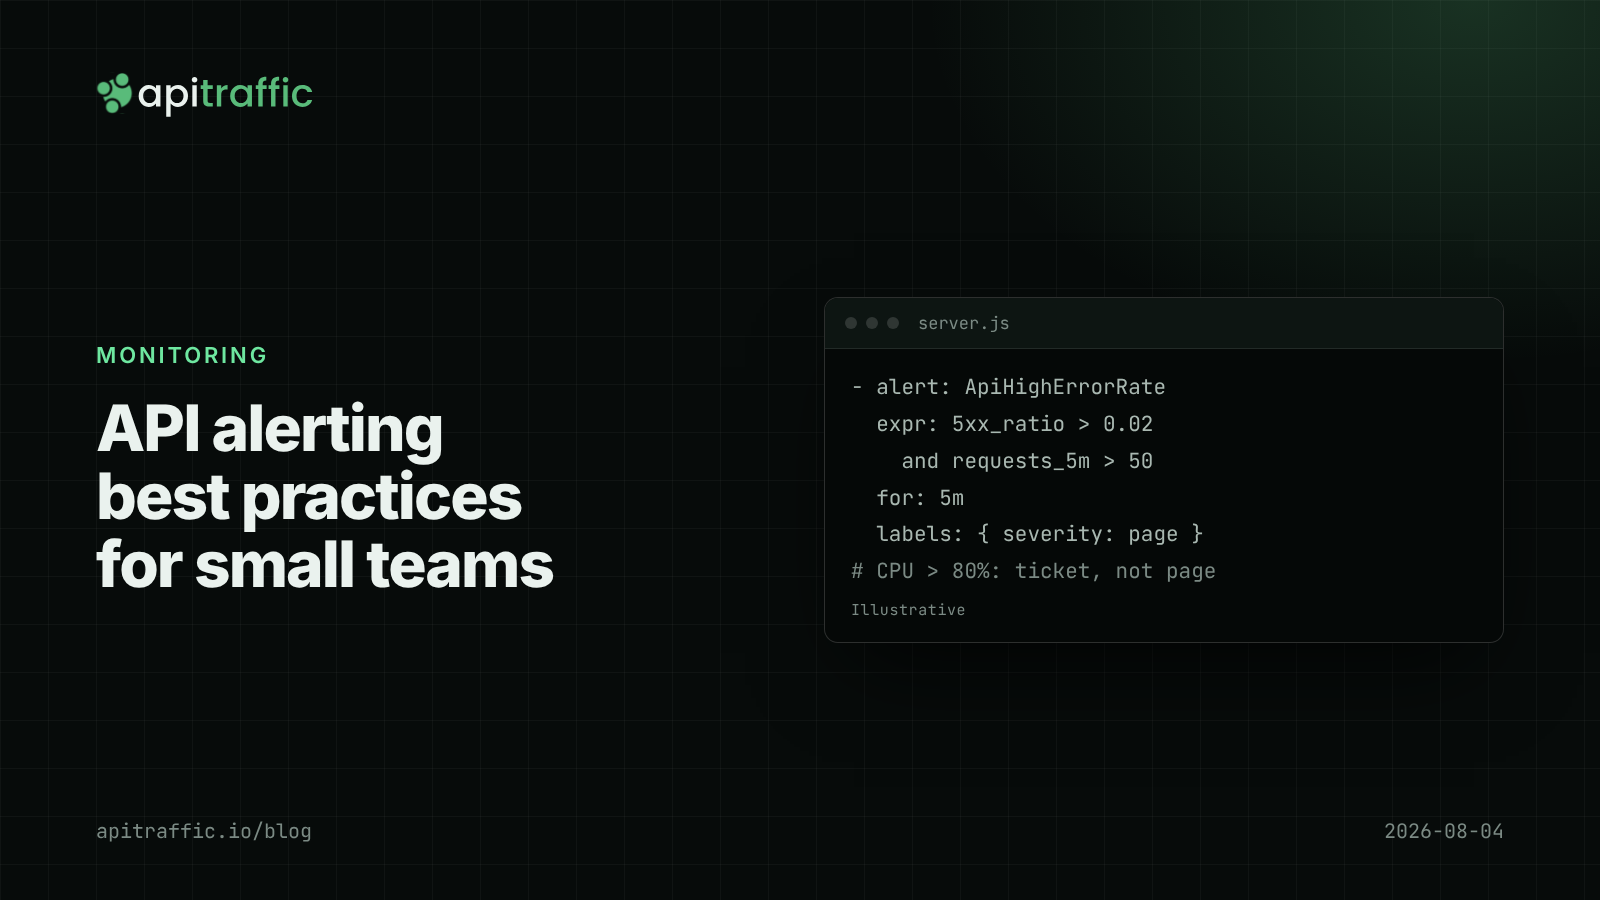
API alerting best practices: what to page on for a Node API
A 3am CPU page that meant nothing, then a real outage that paged nobody. Here is the short list of alerts a small Node API team needs, with rules and code to match.