
Posts tagged “Latency”

Express monitoring: route-level metrics, APM and alerts for Express 4 and 5
Most Express metrics are labelled by raw URL and miss async errors. Build route-level metrics with prom-client, add OpenTelemetry in the right load order, and set alerts, with code we ran on Express 4.22.3 and 5.3.0.
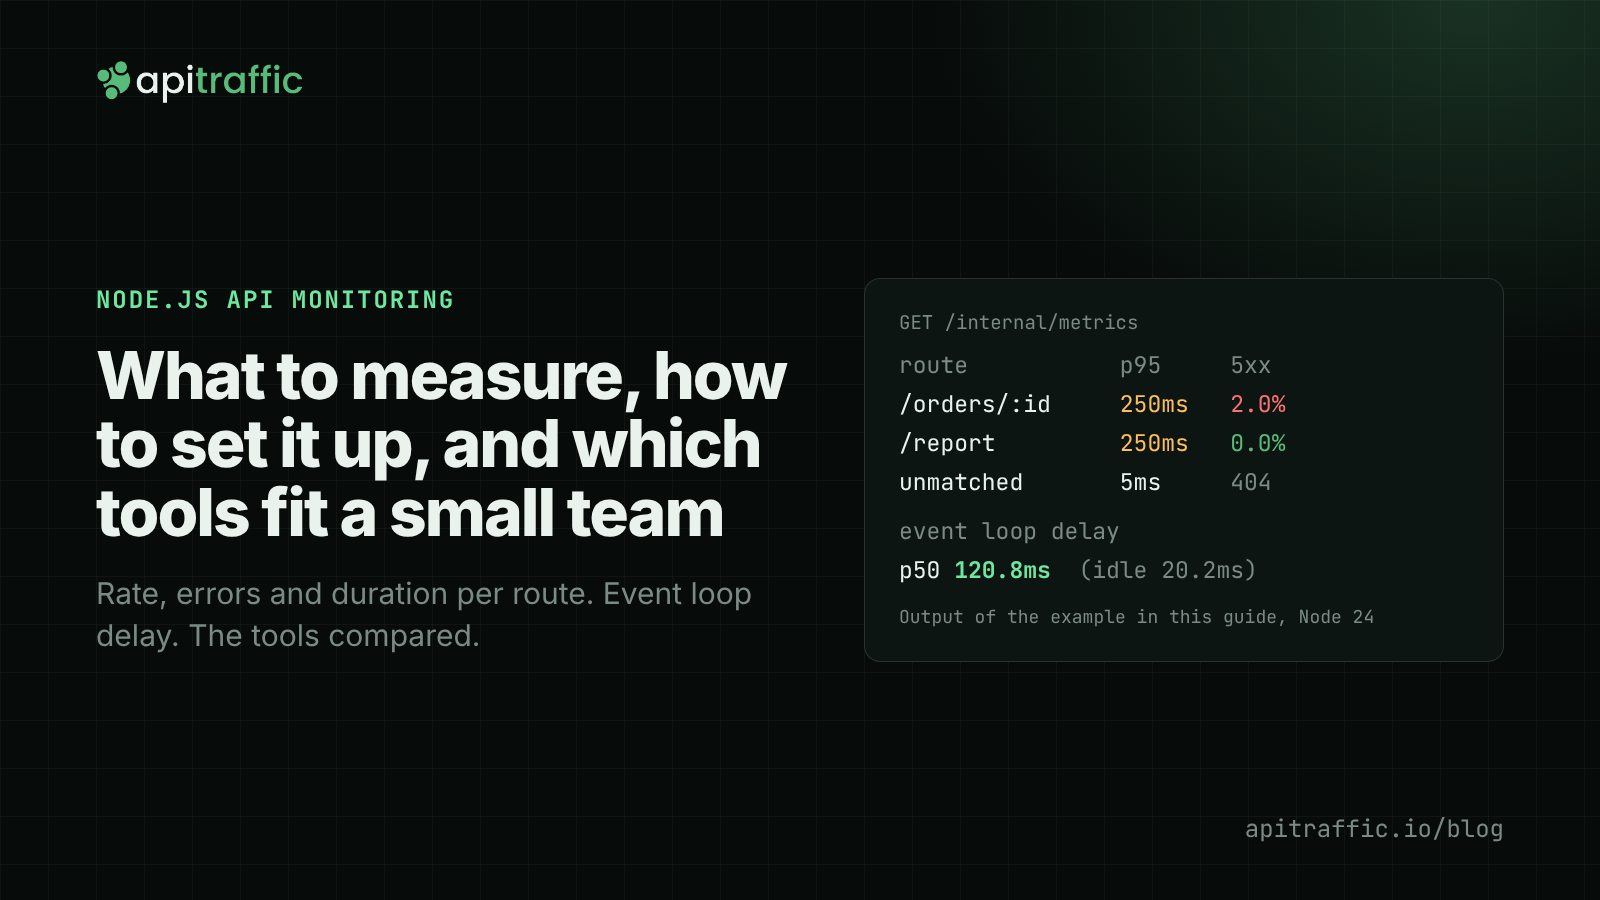
Node.js API monitoring: what to measure, how to set it up, and which tools fit a small team
Uptime checks miss most of what breaks a Node API. What to measure per route and per process, a tested Express middleware for RED metrics and event loop delay, where OpenTelemetry fits, a fair tool comparison and the alerts worth paging on.
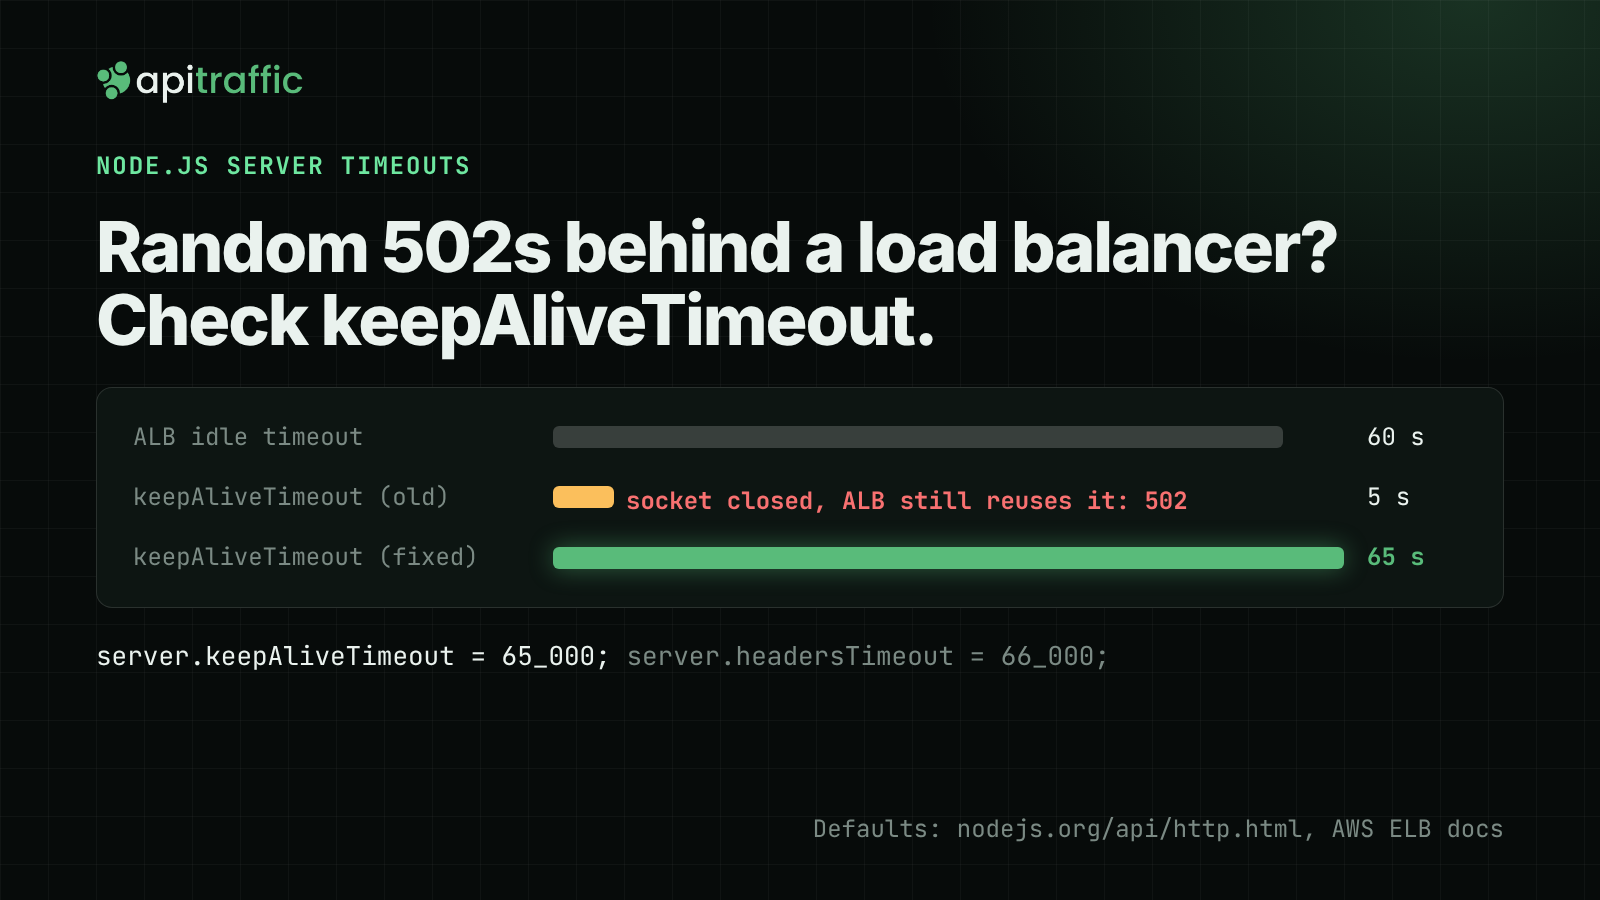
Node.js server timeouts: requestTimeout, headersTimeout and keepAliveTimeout
Random 502s behind a load balancer often come down to one setting: keepAliveTimeout. What each Node.js server timeout controls, safe values behind an AWS ALB, and how to confirm the fix.

Your Node API isn't slow. It's waiting for a database connection.
Fine in testing, then 200 people open the same page and the endpoint takes ten seconds. CPU is flat and Postgres says every query is fast. That's pool starvation. Here's why it happens in Node, how to spot it, the fixes with code, and how to prove they worked.
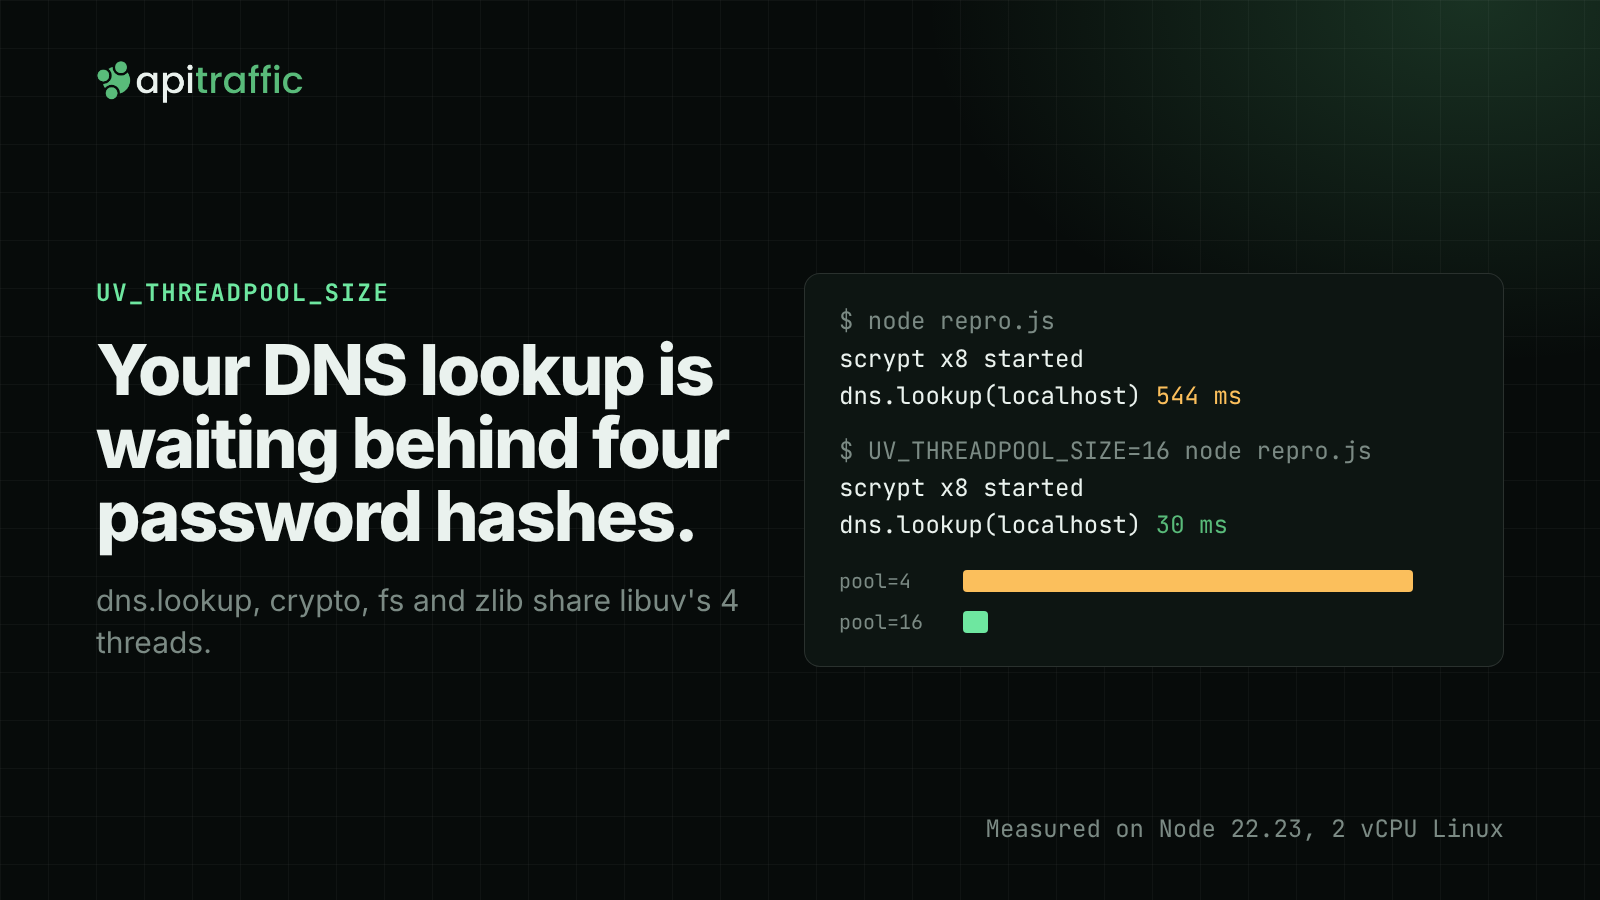
UV_THREADPOOL_SIZE in Node.js: when DNS lookups, crypto and fs wait in the same line
Outbound calls slow down under load while CPU stays low? DNS lookups, crypto and fs share libuv's 4-thread pool in Node. How to reproduce the queue, measure it per upstream, and set UV_THREADPOOL_SIZE.

Deploy markers: tying a latency regression to the release that caused it
p95 doubled, and there were three deploys and a flag flip since yesterday. Deploy markers and a version field on every log line turn "which release did this" into a five-minute query. Here is how to set both up for a Node API.
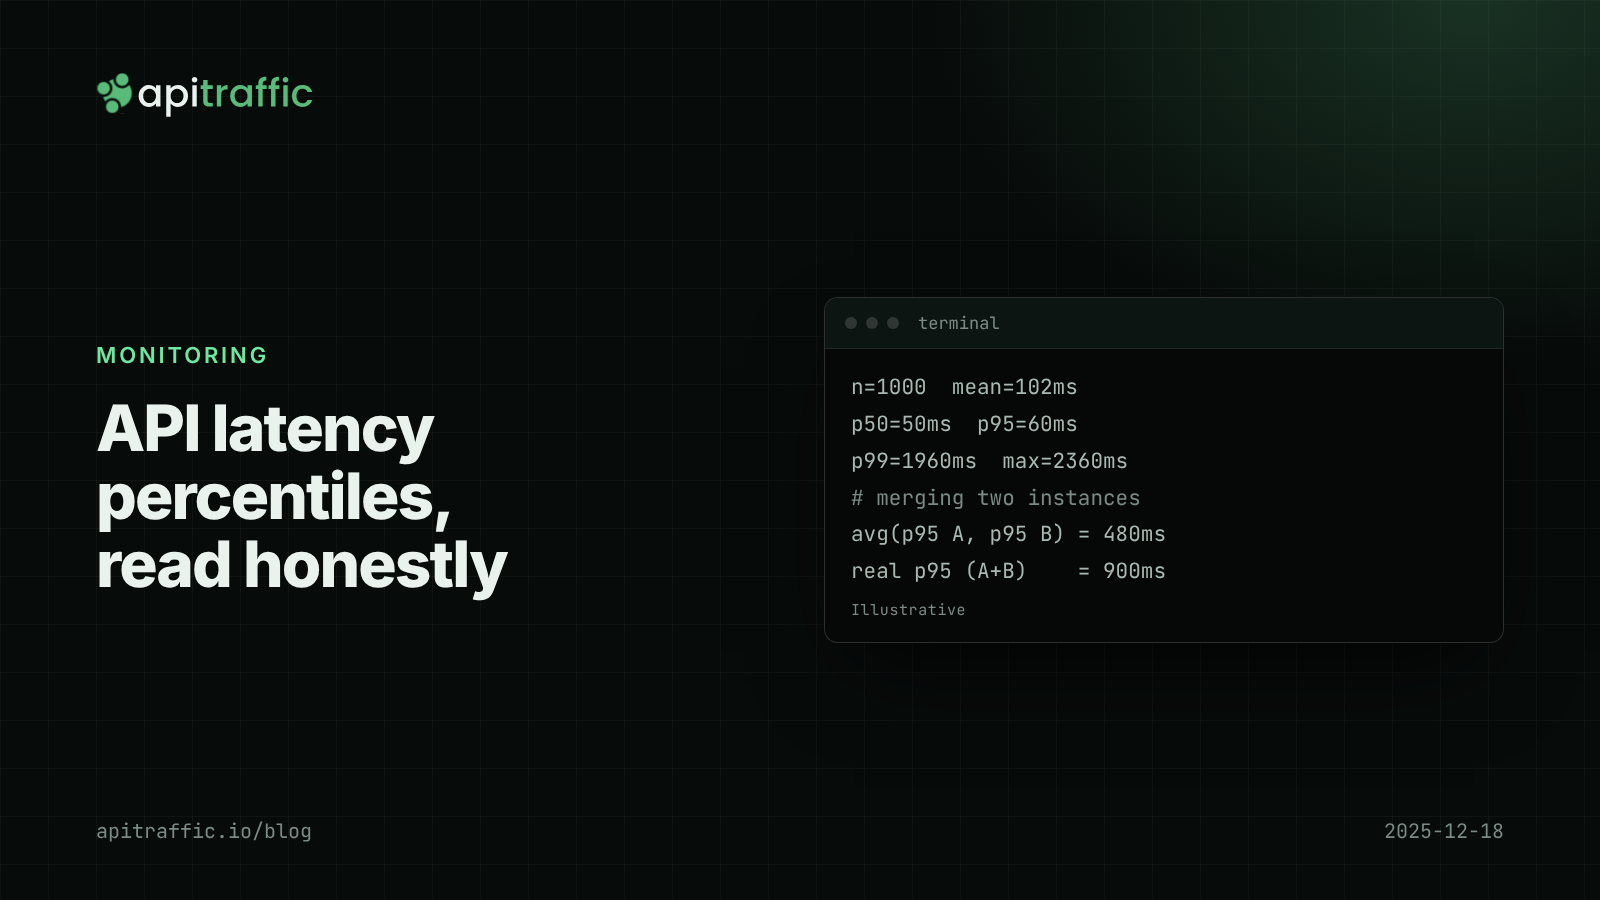
API latency percentiles: how to read p50, p95 and p99 without fooling yourself
Your average latency says 102 ms; a customer says the app hangs for two seconds. Both are true. Learn to read p50, p95 and p99, avoid the four classic mistakes, and record percentiles per route in Node.