
Posts tagged “Monitoring”

Deploy markers: tying a latency regression to the release that caused it
p95 doubled, and there were three deploys and a flag flip since yesterday. Deploy markers and a version field on every log line turn "which release did this" into a five-minute query. Here is how to set both up for a Node API.

Third-party API latency: measuring vendor slowness and failures in Node
The vendor status page is green and your checkout is slow. Here is how to measure third-party API latency and failures from your own Node servers, per dependency, without wrapping fetch.
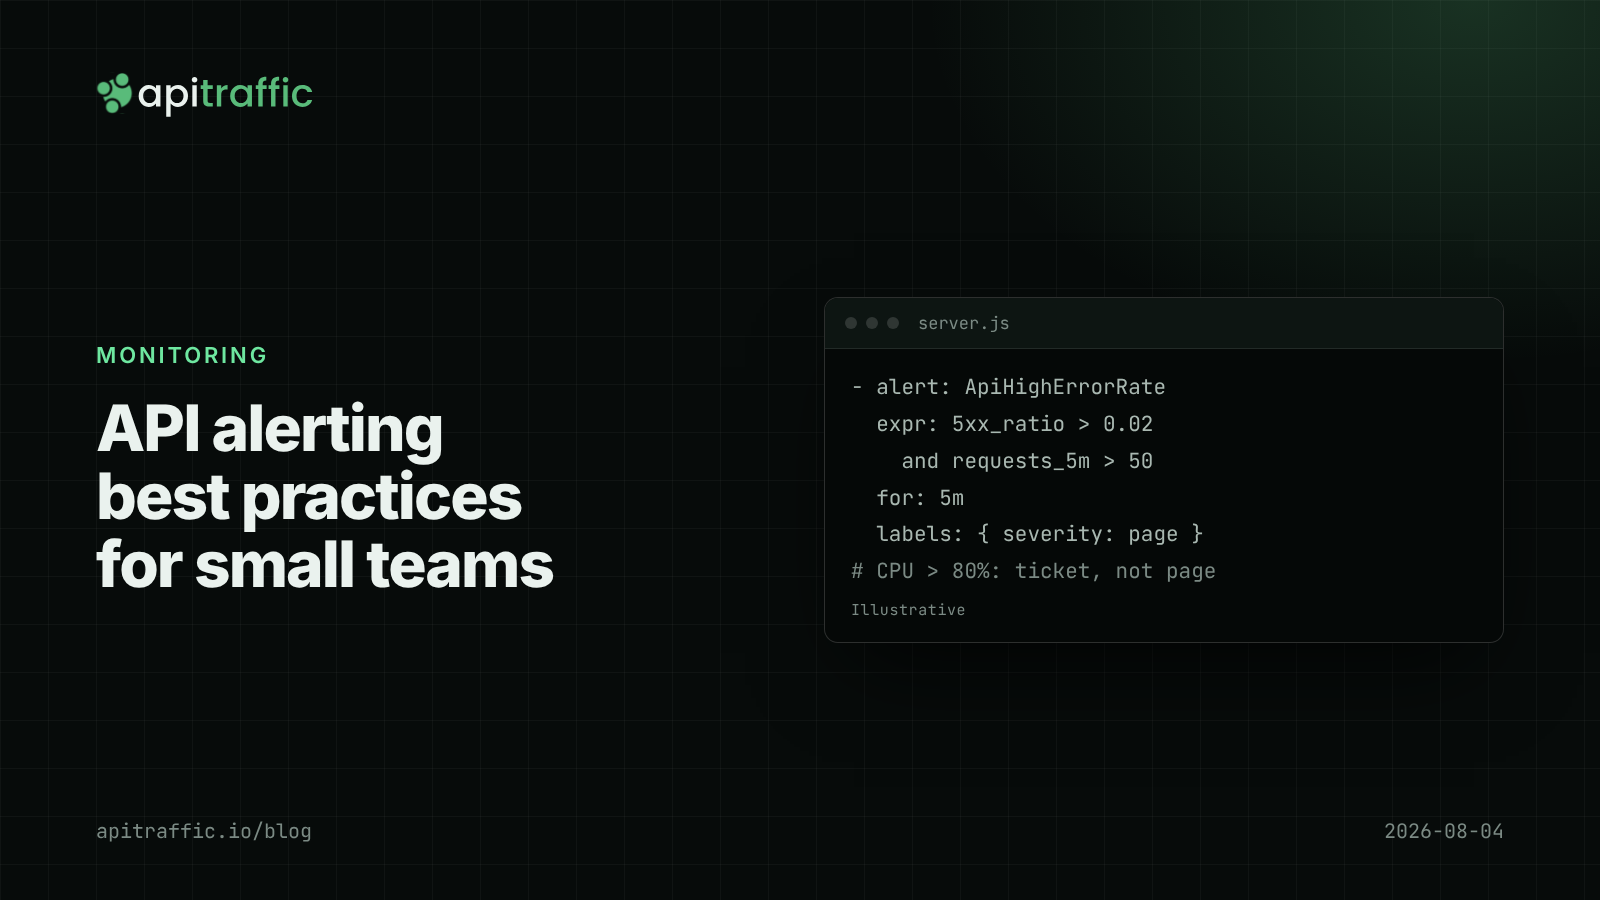
API alerting best practices: what to page on for a Node API
A 3am CPU page that meant nothing, then a real outage that paged nobody. Here is the short list of alerts a small Node API team needs, with rules and code to match.
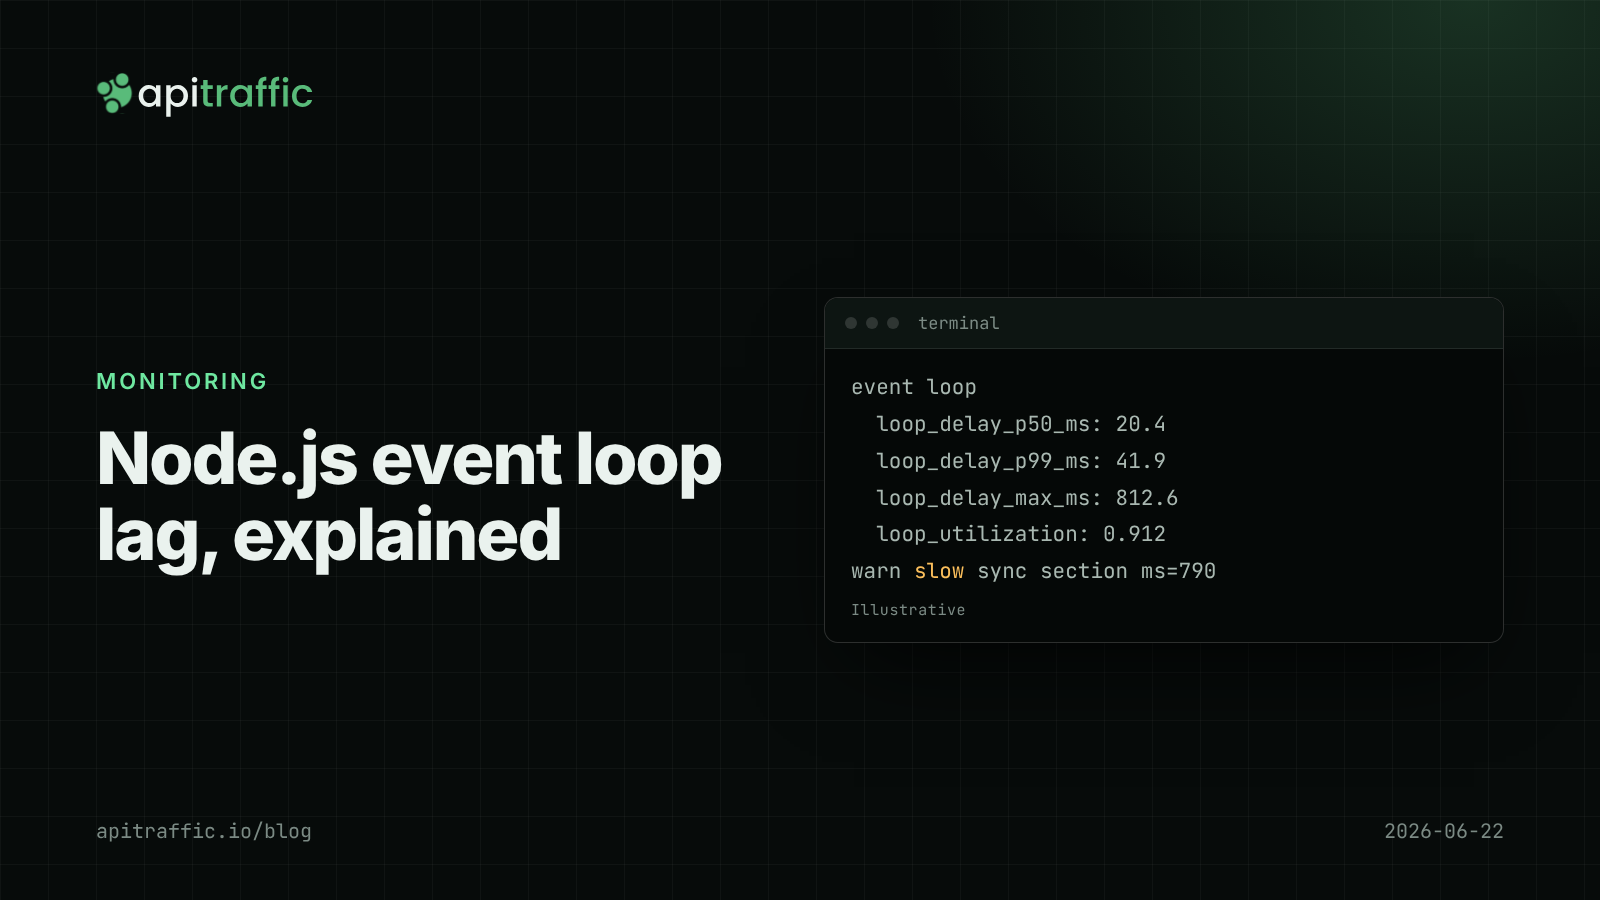
Node.js event loop lag: the metric that explains "random" slowness
Every endpoint slow at once, database fine, CPU looks idle: that is event loop lag. Here is how to measure it in Node with built-in tools and find the code that blocks.
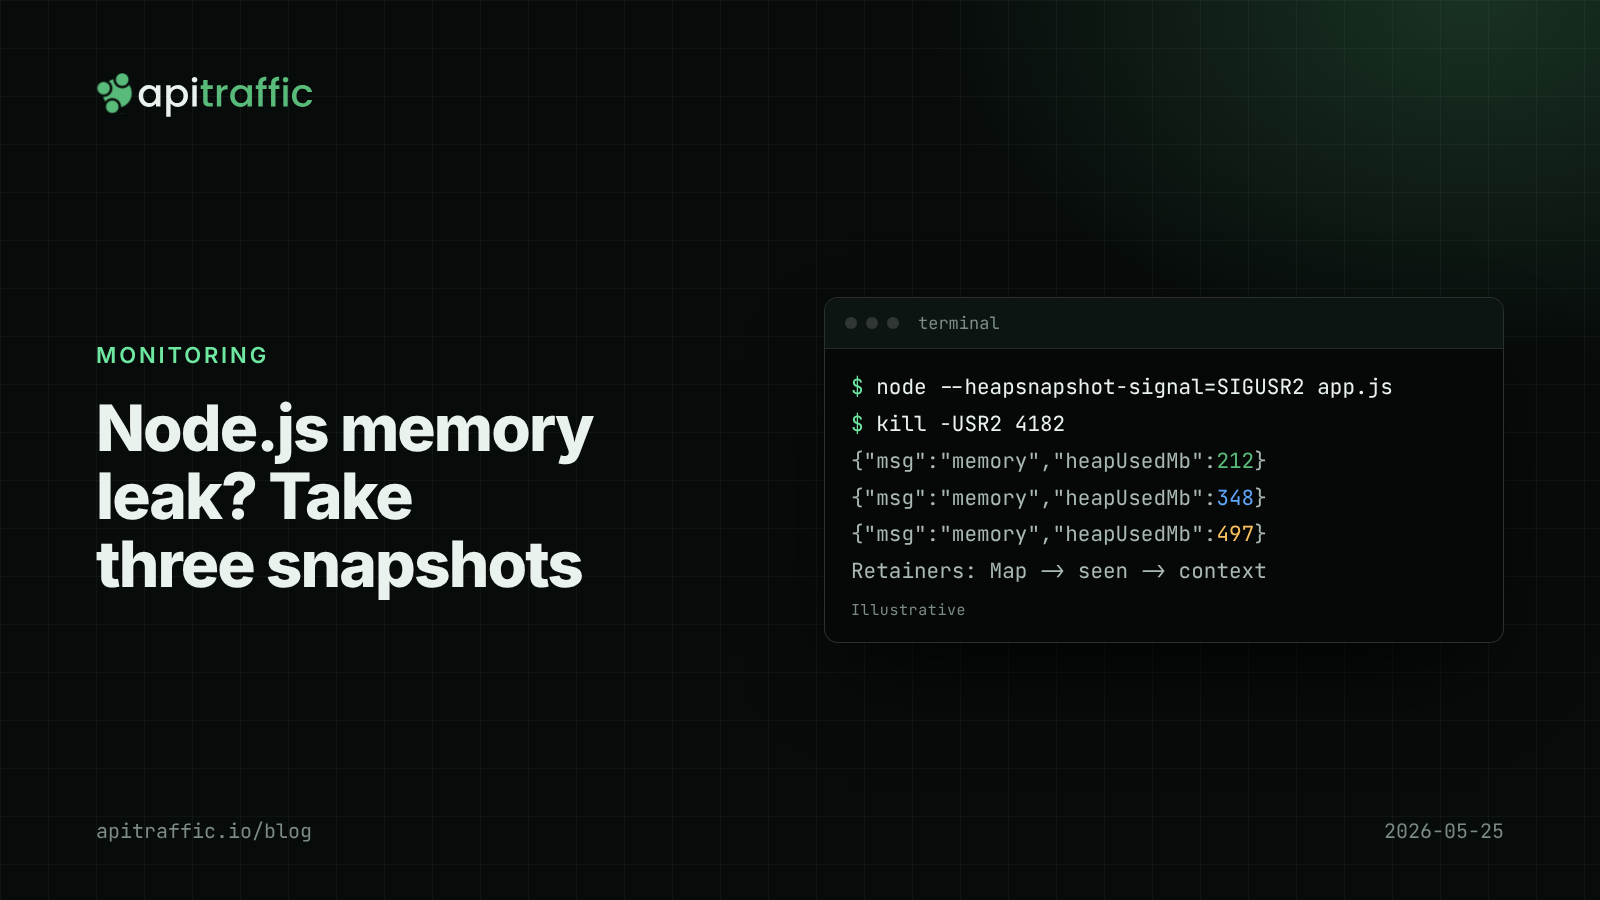
Node.js memory leak debugging with heap snapshots
The container keeps getting OOM-killed and restarts hide why. Here is the three-snapshot method that finds a Node.js memory leak, and how to do it safely in production.
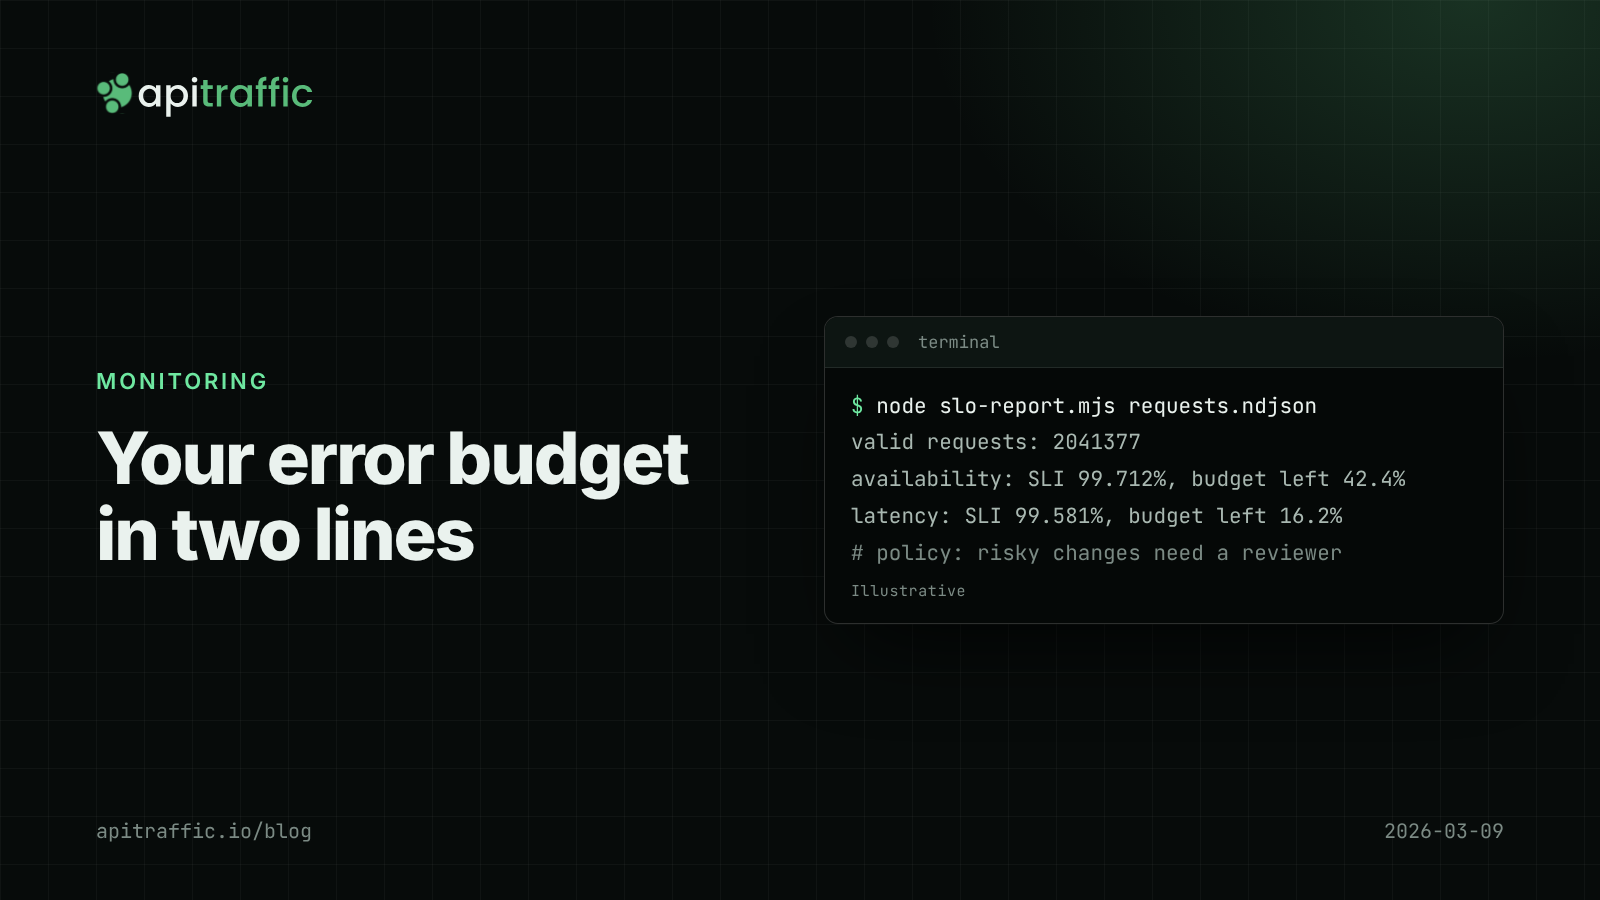
SLOs and an error budget for a small API team, without the enterprise ceremony
Is a 0.4% error rate bad? Without a target, nobody knows. Set one availability and one latency SLO for your Node API, compute the error budget from your request logs, and agree what happens when it runs out.

Node.js health checks that tell the truth: liveness vs readiness
A database blip should not restart every replica of your API. Split /health into liveness and readiness, with Express and Fastify code you can ship today.
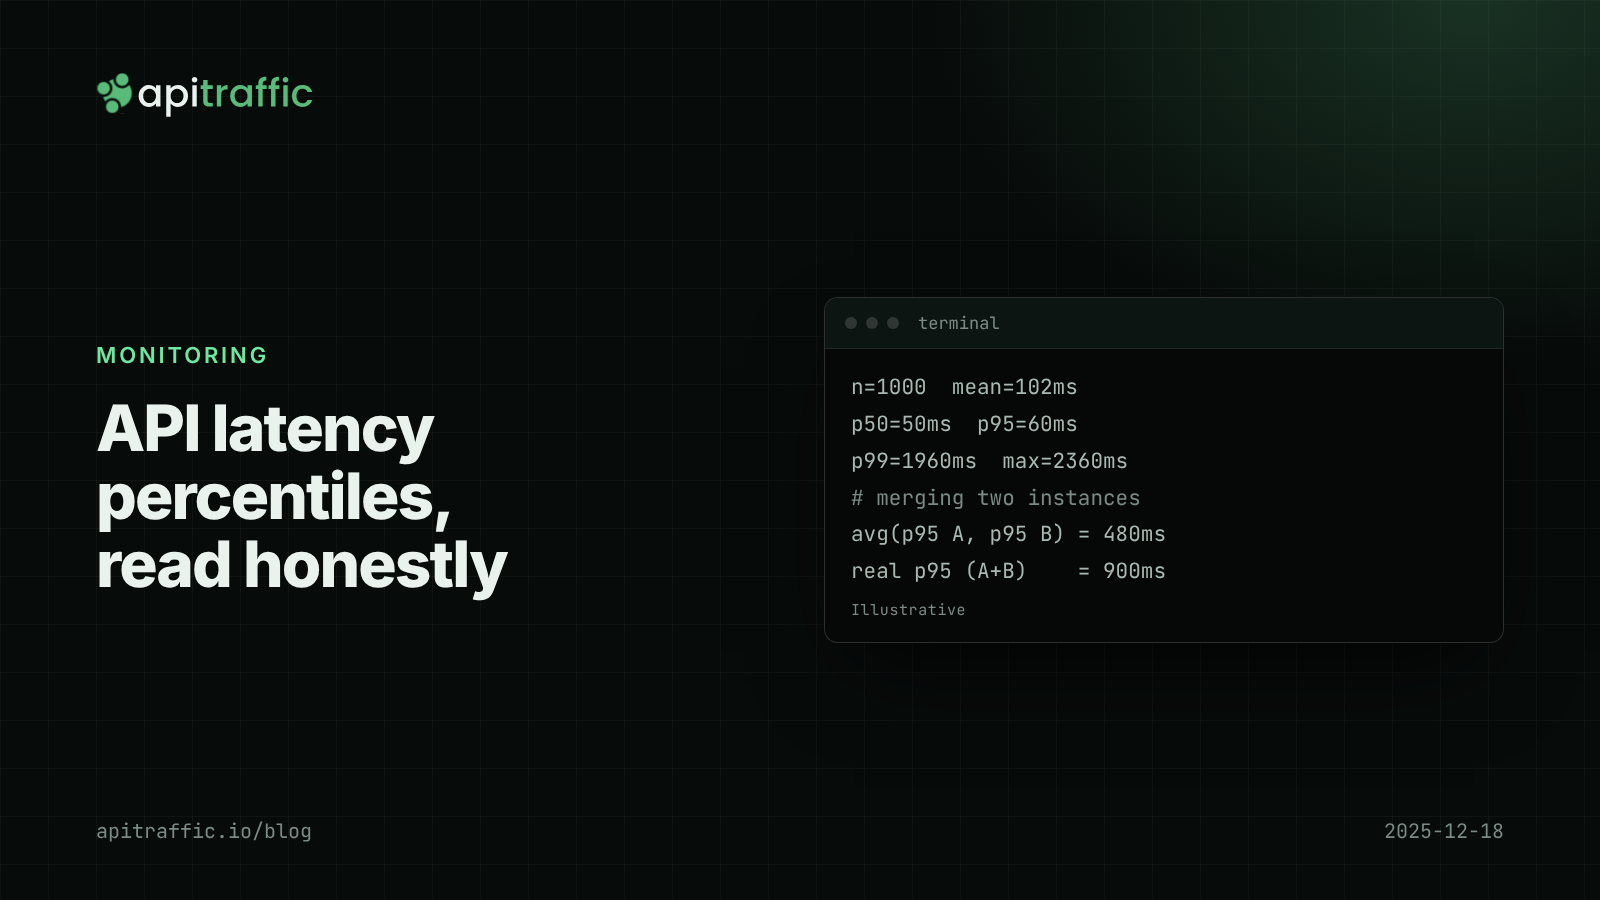
API latency percentiles: how to read p50, p95 and p99 without fooling yourself
Your average latency says 102 ms; a customer says the app hangs for two seconds. Both are true. Learn to read p50, p95 and p99, avoid the four classic mistakes, and record percentiles per route in Node.