
hapi monitoring and logging: hapi-pino, request lifecycle events and APM
hapi-pino setup, per-route metrics, Boom error logging and OpenTelemetry traces for hapi 21, tested and versioned.

hapi monitoring comes down to three layers, and hapi 21 gives you a clean hook for each. For logs, register hapi-pino and you get one JSON line per request with status and response time. For metrics, listen to the server’s response event and record duration by request.route.path, the route template, so /v1/orders/123 and /v1/orders/456 count as one endpoint. For traces, load OpenTelemetry’s hapi instrumentation before hapi itself. This guide sets up all three with code we ran, then covers logging Boom errors, redacting payloads and how the tools that support hapi compare.
Tested with Node.js 22.23.4, @hapi/hapi 21.4.13, hapi-pino 13.0.0 (pino 9.14.0), @hapi/boom 10.0.1, prom-client 15.1.3, @opentelemetry/sdk-node 0.301.2, @opentelemetry/instrumentation-hapi 0.71.0 and @apitraffic/node 3.1.0. The output shown is what those versions printed.
If you want the framework-neutral version of this first, read the Node.js API monitoring guide and the Node.js API logging guide. The sibling posts cover Express monitoring, Fastify monitoring and Koa monitoring and logging.
The hapi request lifecycle: where monitoring hooks in
hapi runs every request through a fixed request lifecycle: onRequest, route lookup, auth, onPreHandler, the handler, onPreResponse, the response is sent, then onPostResponse. Two details of that order matter for monitoring.
onRequestruns before routing. Anything you read fromrequest.routethere describes hapi’s not-found route, not the route that will handle the request.- The server emits a
responseevent once per request after the response has gone out (or the client has gone away). It is the right place to log and to record timings, because it never sits between your handler and the client.
request.info carries the timestamps. received is when hapi got the request and responded is when it finished sending, so the difference is the response time in milliseconds. Here is the smallest useful request logger, no plugins:
const Hapi = require('@hapi/hapi');

const init = async () => {
  const server = Hapi.server({ port: 3000 });

  server.route({
    method: 'GET',
    path: '/v1/orders/{orderId}',
    handler: async (request) => {
      await new Promise((r) => setTimeout(r, 40)); // stand-in for a DB call
      return { id: request.params.orderId, status: 'paid' };
    }
  });

  // Fires once per request, after the response is sent (or the client goes away)
  server.events.on('response', (request) => {
    const { received, responded } = request.info;
    console.log(JSON.stringify({
      method: request.method.toUpperCase(),
      route: request.route.path,          // '/v1/orders/{orderId}', not '/v1/orders/123'
      path: request.path,
      status: request.response?.statusCode,
      ms: responded ? responded - received : null,
      remote: request.info.remoteAddress
    }));
  });

  await server.start();
};

init();
Three requests, two real orders and one typo:
{"method":"GET","route":"/v1/orders/{orderId}","path":"/v1/orders/123","status":200,"ms":45,"remote":"127.0.0.1"}
{"method":"GET","route":"/v1/orders/{orderId}","path":"/v1/orders/456","status":200,"ms":42,"remote":"127.0.0.1"}
{"method":"GET","route":"/{p*}","path":"/nope","status":404,"ms":1,"remote":"127.0.0.1"}
Note the last line. Unmatched requests report /{p*} as their route, so a scanner probing /.env and /wp-admin shows up as one bucket instead of hundreds. responded is 0 when the client disconnected before hapi finished, which is why the code checks it.
Behind a load balancer, request.info.remoteAddress is the balancer’s address. hapi has no trust-proxy setting, so read the header your edge sets (x-forwarded-for, cf-connecting-ip) and only trust it if the server is reachable from the edge alone.
hapi logging with hapi-pino
For hapi logging in production, use hapi-pino. It is maintained by the pino team, wraps pino, and hooks the hapi events you’d otherwise wire up by hand. Install it next to hapi:
npm install hapi-pino
A production-shaped setup with redaction, a skipped health check and per-request bindings:
const Hapi = require('@hapi/hapi');

const init = async () => {
  const server = Hapi.server({ port: 3000 });

  await server.register({
    plugin: require('hapi-pino'),
    options: {
      level: process.env.LOG_LEVEL || 'info',
      redact: ['payload.password', 'payload.token', 'req.headers.authorization'],
      ignorePaths: ['/healthz'],
      logPayload: true,
      logPathParams: true,
      getChildBindings: (request) => ({ reqId: request.info.id })
    }
  });

  server.route({ method: 'GET', path: '/healthz', handler: () => 'ok' });

  server.route({
    method: 'POST',
    path: '/v1/login',
    handler: (request, h) => {
      request.log(['auth'], 'login attempt');
      return h.response({ ok: true }).code(200);
    }
  });

  await server.start();
};

init();
A GET /healthz followed by a login with a bearer token and a password in the body printed this (the health check printed nothing):
{"level":30,"time":1794521908994,"pid":441,"hostname":"vm","reqId":"1794521908991:vm:441:mwe40esq:10001","tags":["auth"],"data":"login attempt"}
{"level":30,"time":1794521908995,"pid":441,"hostname":"vm","reqId":"1794521908991:vm:441:mwe40esq:10001","payload":{"email":"[email protected]","password":"[Redacted]"},"pathParams":{},"res":{"statusCode":200,"headers":{"content-type":"application/json; charset=utf-8","cache-control":"no-cache","content-length":11}},"responseTime":4,"msg":"[response] post /v1/login 200 (4ms)"}
What we learned running it:
- The completion line has no
reqobject. Request headers only appear if you turn onlogRequestStart: true; with it on, theauthorizationheader in that line came out as"[Redacted]". Keep the header path inredactanyway, so turning that option on later doesn’t leak tokens. logPayload: truelogs the parsed body. The password was redacted, the email was not. Every field you don’t name inredactis written as-is, so list the personal data your routes accept, or leave payload logging off and log the fields you need from the handler.getChildBindingsruns atonRequest, before routing. Our first version boundroute: request.route.paththere and every line said/{p*}. Bind the request ID there, and read the route at response time.request.log(tags, data)writes through the same child logger, so handler logs carry the samereqIdas the completion line. That ID is what lets you pull every line for one bad request.ignorePathstakes exact paths. For a group of routes, tag them (options: { tags: ['health'] }) and useignoreTags: ['health'], or passignoreFuncfor anything more custom.
hapi-pino also exposes server.logger, a plain pino instance, for logs outside a request (startup, jobs, shutdown).
Metrics per route.path
Logs tell you what happened to one request. Metrics tell you whether /v1/orders/{orderId} is slower than it was yesterday, and they’re what you alert on. With prom-client, one histogram keyed by method, route template and status class covers rate, errors and latency percentiles:
const Hapi = require('@hapi/hapi');
const client = require('prom-client');

const httpDuration = new client.Histogram({
  name: 'http_server_duration_seconds',
  help: 'hapi request duration by route template',
  labelNames: ['method', 'route', 'status_class'],
  buckets: [0.025, 0.05, 0.1, 0.25, 0.5, 1, 2.5]
});

const init = async () => {
  const server = Hapi.server({ port: 3000 });

  server.route({
    method: 'GET',
    path: '/metrics',
    options: { tags: ['internal'] },
    handler: async (request, h) =>
      h.response(await client.register.metrics()).type(client.register.contentType)
  });

  server.events.on('response', (request) => {
    if (request.route.path === '/metrics') return;
    const { received, responded } = request.info;
    if (!responded) return; // client went away before a response
    const status = request.response?.statusCode ?? 0;
    httpDuration.observe(
      {
        method: request.method,
        route: request.route.path,           // bounded label: the template, never the raw URL
        status_class: `${Math.floor(status / 100)}xx`
      },
      (responded - received) / 1000
    );
  });

  // ...your routes
  await server.start();
};

init();
After three order lookups and one unknown path, /metrics included:
http_server_duration_seconds_count{method="get",route="/v1/orders/{orderId}",status_class="2xx"} 3
http_server_duration_seconds_count{method="get",route="/{p*}",status_class="4xx"} 1
Use the route template and status class, never request.path or the full status code, as labels. Each distinct label value becomes its own time series, and raw paths with IDs in them will grow your Prometheus storage without limit. From here, histogram_quantile(0.95, sum by (le, route) (rate(http_server_duration_seconds_bucket[5m]))) gives p95 per route. For reading those numbers, see API latency percentiles, and for which of them to page on, API alerting best practices.
Logging Boom errors without leaking them
hapi errors are Boom objects. Throw Boom.badRequest() and the client gets a 400 with your message. Throw anything else, including a plain bug, and hapi wraps it in a 500 whose client-facing message is “An internal server error occurred”. The real message and stack stay on the server, which is right for clients and means you have to log them yourself.
onPreResponse sees every response before it goes out, Boom or not:
const Hapi = require('@hapi/hapi');
const Boom = require('@hapi/boom');

const init = async () => {
  const server = Hapi.server({ port: 3000, debug: false });

  server.route({
    method: 'GET',
    path: '/v1/orders/{orderId}',
    handler: (request) => {
      if (!/^\d+$/.test(request.params.orderId)) {
        throw Boom.badRequest('orderId must be numeric', { orderId: request.params.orderId });
      }
      // A plain bug: hapi wraps it in a Boom 500 for you
      return undefinedThing.find(request.params.orderId);
    }
  });

  server.ext('onPreResponse', (request, h) => {
    const res = request.response;
    if (!res.isBoom) return h.continue;

    const status = res.output.statusCode;
    const entry = {
      route: request.route.path,
      status,
      error: res.output.payload.error,   // what the client sees
      message: res.message,              // what you need
      data: res.data ?? undefined
    };
    if (status >= 500) console.error(JSON.stringify({ ...entry, stack: res.stack.split('\n').slice(0, 2) }));
    else console.warn(JSON.stringify(entry));
    return h.continue;
  });

  await server.start();
};

init();
Calling /v1/orders/abc and then /v1/orders/42:
{"route":"/v1/orders/{orderId}","status":400,"error":"Bad Request","message":"orderId must be numeric","data":{"orderId":"abc"}}
{"route":"/v1/orders/{orderId}","status":500,"error":"Internal Server Error","message":"undefinedThing is not defined","stack":["ReferenceError: undefinedThing is not defined","    at handler (/root/hapi/errors.js:15:7)"]}
The clients received {"statusCode":400,"error":"Bad Request","message":"orderId must be numeric"} and {"statusCode":500,"error":"Internal Server Error","message":"An internal server error occurred"}. The data you attach to a Boom error is logged but never sent to the client, which makes it a good place for the IDs you’ll want during an incident.
debug: false matters once you log errors yourself. hapi’s default prints Debug: internal, implementation, error with a full stack to the console for every 500, so without it each bug is logged twice in two formats. If you use hapi-pino, it already logs request errors at warn level, so pick one place (the plugin or your extension) for 5xx and keep the other for 4xx context.
Tracing hapi with OpenTelemetry
For traces, use @opentelemetry/instrumentation-hapi together with the HTTP instrumentation. The SDK has to load before hapi, so put it in its own file and preload it:
npm install @opentelemetry/sdk-node @opentelemetry/exporter-trace-otlp-proto \
  @opentelemetry/instrumentation-http @opentelemetry/instrumentation-hapi
// tracing.js: load it before anything else: node -r ./tracing.js server.js
const { NodeSDK } = require('@opentelemetry/sdk-node');
const { OTLPTraceExporter } = require('@opentelemetry/exporter-trace-otlp-proto');
const { HttpInstrumentation } = require('@opentelemetry/instrumentation-http');
const { HapiInstrumentation } = require('@opentelemetry/instrumentation-hapi');

const sdk = new NodeSDK({
  serviceName: 'orders-api',
  traceExporter: new OTLPTraceExporter(), // OTEL_EXPORTER_OTLP_ENDPOINT, default http://localhost:4318
  instrumentations: [new HttpInstrumentation(), new HapiInstrumentation()]
});

sdk.start();
process.on('SIGTERM', () => sdk.shutdown().finally(() => process.exit(0)));
Swapping the exporter for the console one and calling the orders route gave two spans per request (trimmed to the fields that matter):
name: 'GET /v1/orders/{orderId}'      kind: 1 (server)   'http.route': '/v1/orders/{orderId}', 'http.response.status_code': 200
name: 'route - /v1/orders/{orderId}'  kind: 0 (internal) 'http.route': '/v1/orders/{orderId}', 'hapi.type': 'router'
The HTTP span is named by route template, so your tracing backend groups it per endpoint without extra work. The hapi instrumentation adds a child span for the route handler, and spans for lifecycle extensions, whether you add them directly or through a plugin. Add database and Redis instrumentations (or @opentelemetry/auto-instrumentations-node) to see where the time inside a slow request goes.
In the 0.30x SDK line, SimpleSpanProcessor takes an options object (new SimpleSpanProcessor({ exporter })) rather than the exporter itself. Older tutorials pass the exporter directly, which now fails at export time with Cannot read properties of undefined (reading 'export'). traceExporter on NodeSDK, as above, works either way.
hapi monitoring options compared
All of these work with hapi 21. They solve different parts of the problem, and most teams combine two.
| Option | Good at | Keep in mind |
|---|---|---|
| hapi-pino + a log store (Loki, Elasticsearch, a hosted log service) | Cheap, structured request logs with redaction; easy to search one request ID | No traces; aggregates depend on what your log store can query |
| prom-client + Prometheus and Grafana | Per-route rate, error and latency alerts at very low cost | Tells you a route is slow, not which request or why |
| OpenTelemetry + any OTLP backend (Jaeger, Grafana Tempo, Honeycomb and others) | Vendor-neutral traces you can move between backends | You run or pay for the backend, and keep the SDK versions in step |
| Sentry | Errors with stack traces and context, release tracking, performance tracing | Built around errors and transactions, not a full request and response log |
| Elastic APM Node.js agent | Automatic hapi instrumentation for teams already on the Elastic stack | Makes most sense if you run, or buy, Elastic |
| Datadog APM (dd-trace) | hapi tracing inside a platform that also covers infrastructure, logs and dashboards | Most useful if you’ll use the wider platform, not tracing alone |
| ApiTraffic | Every request and response per route, APM spans and a firewall from one plugin | Node-focused; covers request traffic rather than host and infrastructure metrics |
Doing this with ApiTraffic (hapi 21)
If you’d rather not wire up the logger, the histogram, the OTel SDK and the error hook separately, ApiTraffic’s hapi plugin does it with one registration. It supports @hapi/hapi 21 on Node.js 20 or later:
const Hapi = require('@hapi/hapi');
const apitraffic = require('@apitraffic/node');

const init = async () => {
  const server = Hapi.server({ port: 3000 });

  await server.register(apitraffic.hapi()); // reads API_TRAFFIC_TOKEN and API_TRAFFIC_BUCKET

  server.route({
    method: 'GET',
    path: '/v1/orders/{orderId}',
    handler: async (request) => {
      apitraffic.tag('customerId', String(request.headers['x-customer-id'] ?? 'anon'));
      return apitraffic.span('db.query', 'load order', async () => ({ id: request.params.orderId }));
    }
  });

  await server.start();
};

init();
- It hooks
onRequest,onPreHandlerandonPostResponse, so it covers routes added before or after registration, and capture happens after the response is committed. - Each request is recorded under the route hapi matched (
/v1/orders/{orderId}), with the request and response bodies, status and timing. Boom errors are recorded with the error response the client got. - Credential headers such as
AuthorizationandCookieare masked in your process by default, and further redaction rules are set in the dashboard. - Calls your app makes with
fetch,httpor axios are captured and linked to the request that made them. For database and cache spans, add@apitraffic/apmand start withnode -r @apitraffic/node/register ./server.js. - The same plugin registers the firewall as an
onPreHandlerextension, so a policy you create can block a request before it reaches your handler. Behind a proxy, passclientIpto read your edge’s header.
See what’s hitting your API: apitraffic.io
FAQ
How do I log requests in hapi?
Register hapi-pino with await server.register({ plugin: require('hapi-pino') }) before server.start(). It writes one JSON line per completed request with method, path, status and response time, and gives each request a child logger through request.log(). For a no-dependency version, listen to server.events.on('response', ...) and read request.info.
How do I get the response time of a request in hapi?
Subtract request.info.received from request.info.responded inside the server’s response event. Both are millisecond timestamps. responded is 0 if the client disconnected before hapi finished, so check it before recording.
What is the best logger for hapi?
For most teams, hapi-pino. It is maintained by the pino team, logs every request as JSON with very little overhead, and supports redaction and per-request child loggers. hapi-pino 13.0.0 ran without problems on hapi 21.4.13 in our tests.
Does OpenTelemetry support hapi?
Yes. @opentelemetry/instrumentation-hapi creates spans for route handlers and request lifecycle extensions, and the HTTP instrumentation names the server span by route template. Load the SDK before hapi with node -r ./tracing.js, or the instrumentation can’t patch it.
How do I stop hapi-pino from logging health checks?
Pass ignorePaths: ['/healthz'] for exact paths, or tag the routes and use ignoreTags: ['health']. For anything more custom, ignoreFunc: (options, request) => boolean replaces both.
Keep reading
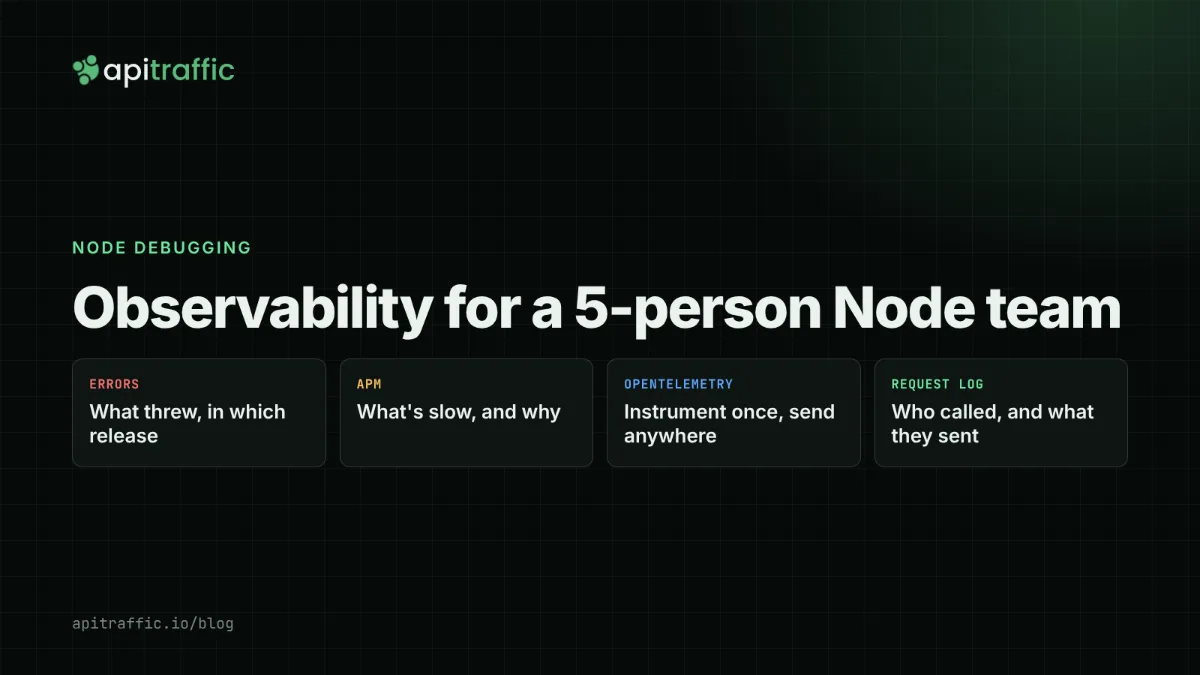
Observability for a 5-person Node team: what each option actually gives you
When a customer says the export failed again, how long until you see the exact request? For most small Node teams the answer is spread across three tools. Here's what each option is built for, the gaps that bite, and a setup you can copy.
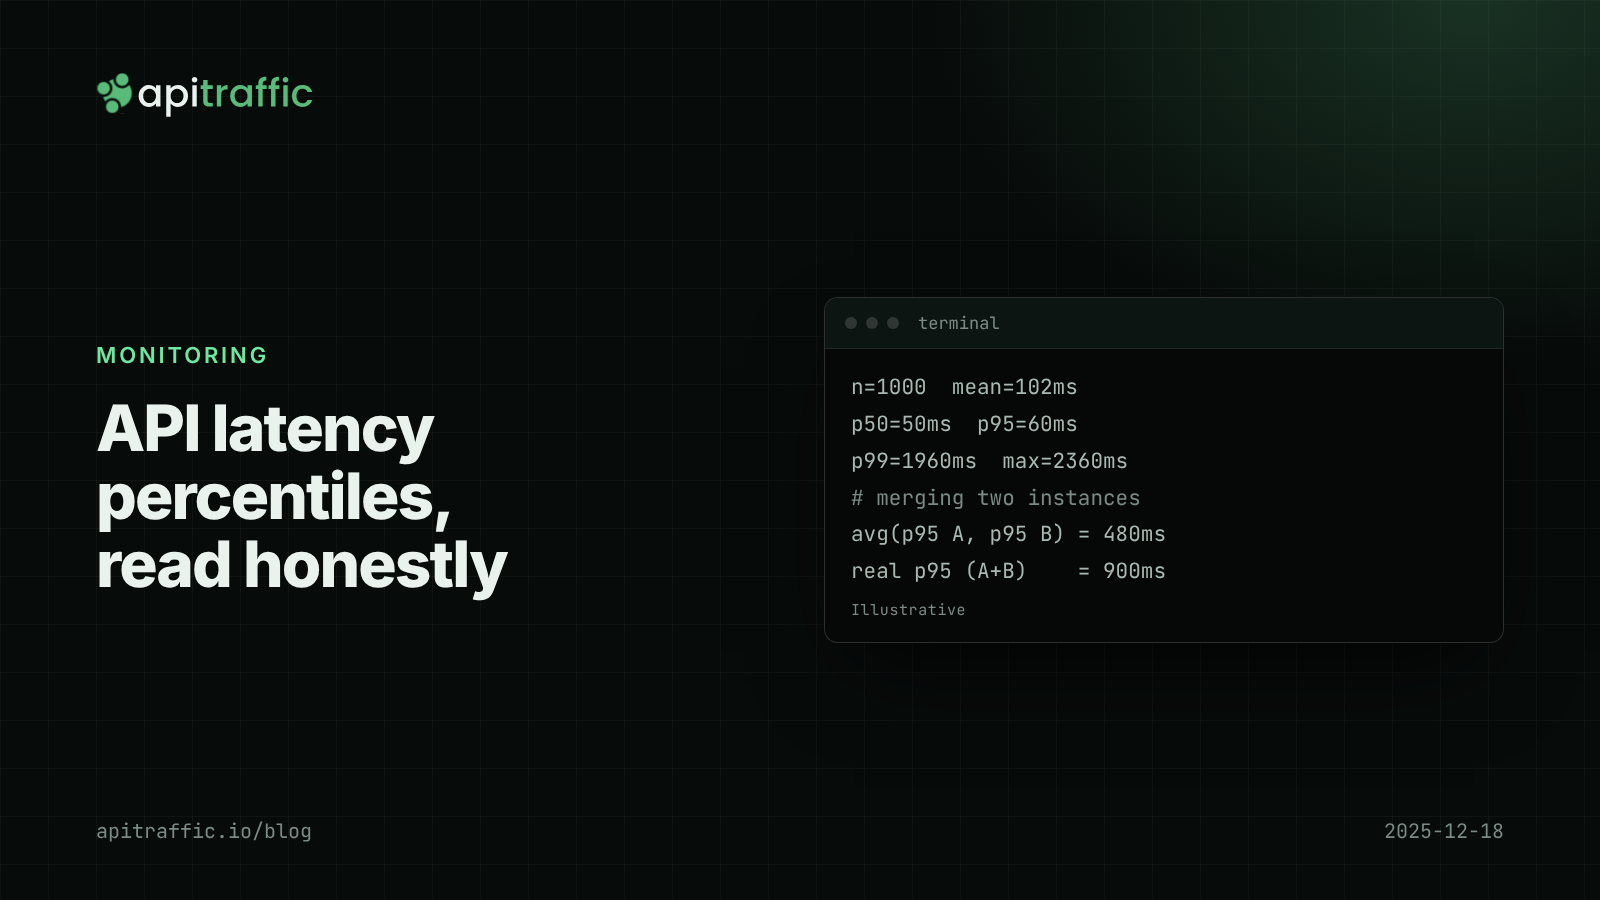
API latency percentiles: how to read p50, p95 and p99 without fooling yourself
Your average latency says 102 ms; a customer says the app hangs for two seconds. Both are true. Learn to read p50, p95 and p99, avoid the four classic mistakes, and record percentiles per route in Node.
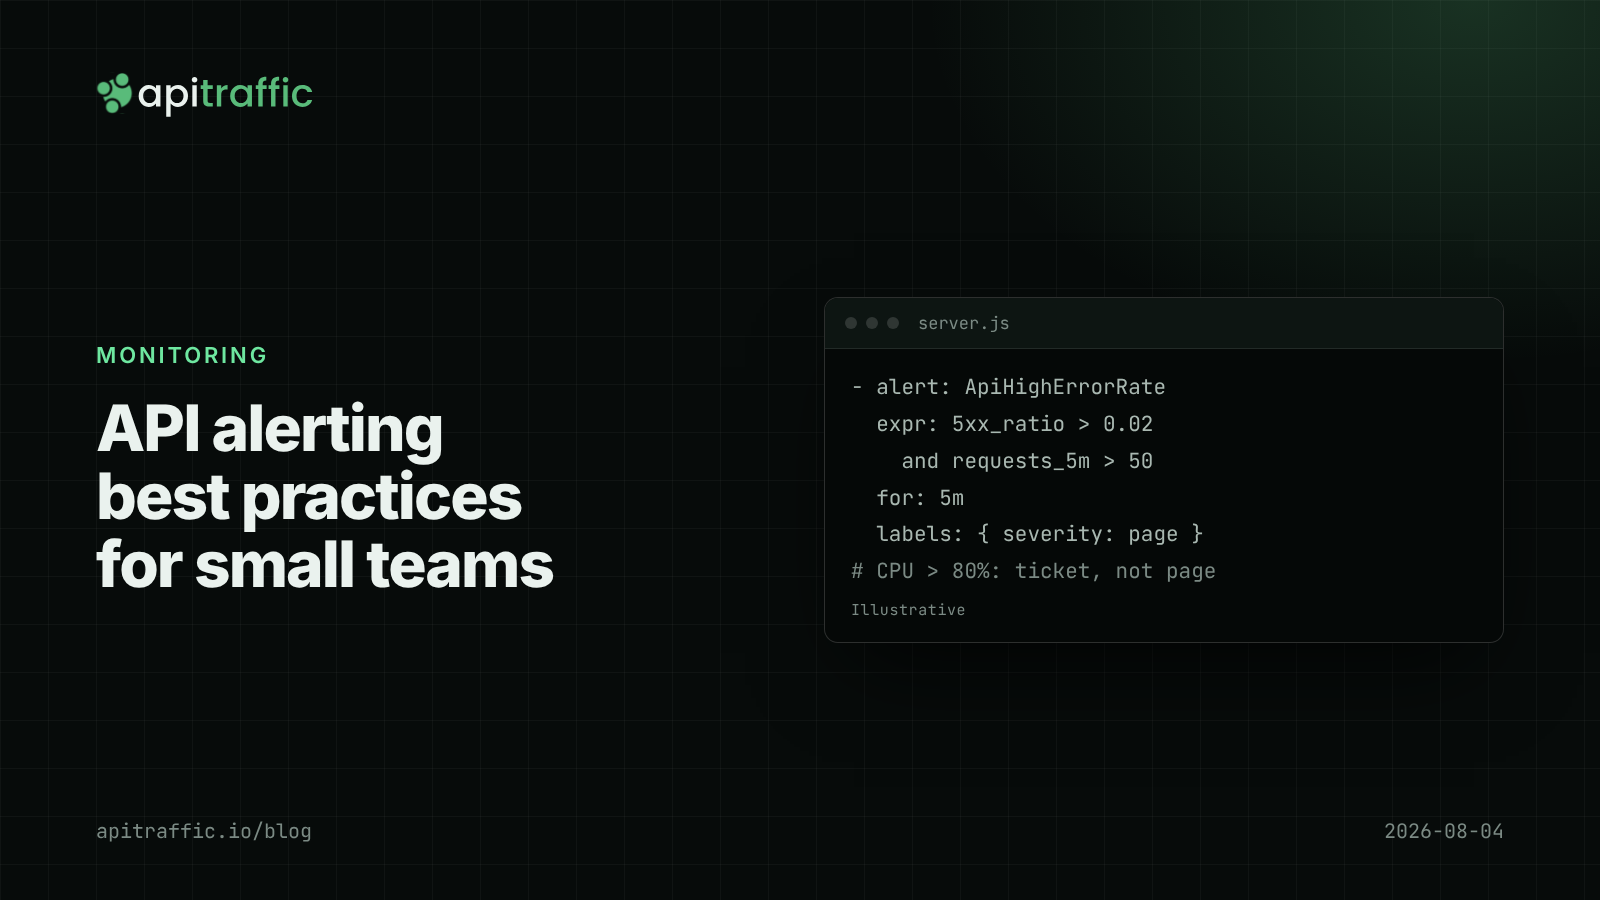
API alerting best practices: what to page on for a Node API
A 3am CPU page that meant nothing, then a real outage that paged nobody. Here is the short list of alerts a small Node API team needs, with rules and code to match.