
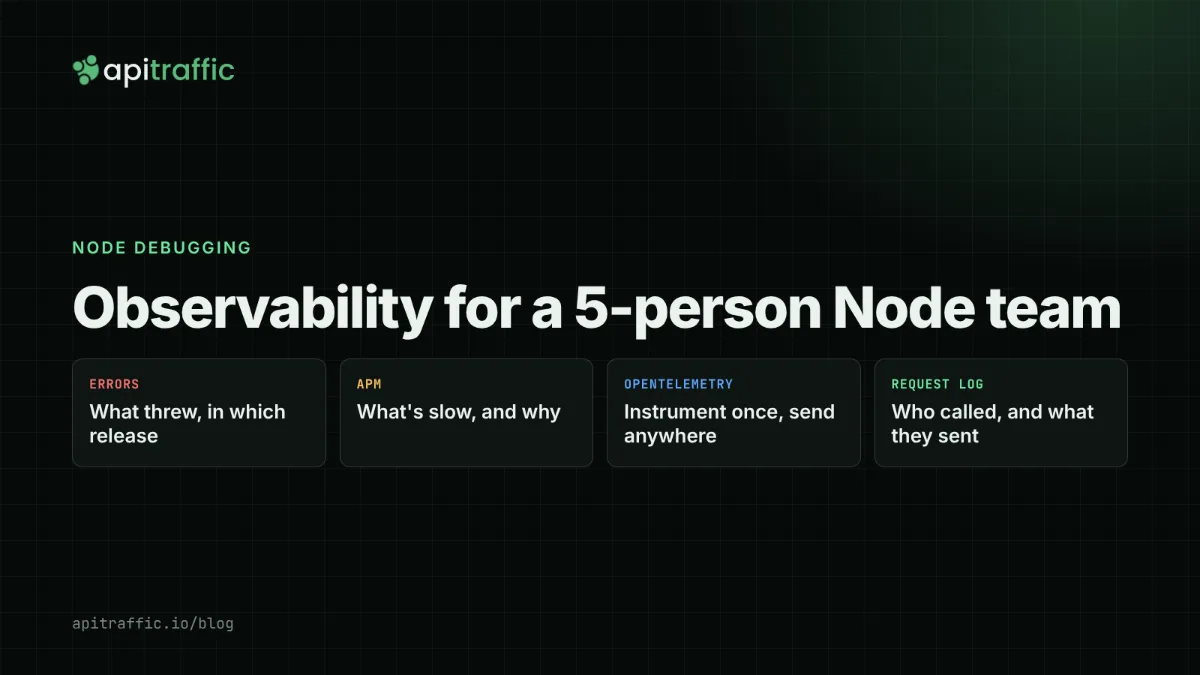
Observability for a 5-person Node team: what each option actually gives you
Error tracking, APM, OpenTelemetry and structured logs: what each gives a small team, and where the gaps are.
A customer emails: “the export failed again this morning.” How long until you’re looking at the exact request that failed, with what they sent, what your API answered, and what it called on the way?
For most small Node teams the honest answer is “a while.” The evidence is spread across two or three tools: an error tracker, maybe an APM agent, and logs that roll over before anyone reads them. On dev.to lately, a lot of posts circle the same problem: NestJS teams comparing Sentry, Datadog and OpenTelemetry, and Express teams wiring Pino or Winston with request IDs by hand so they can follow one request through their logs.
This isn’t a “which tool wins” post. Each option is built for a different job. The useful question is which jobs your team actually has.
What each option is built for
Error tracking (for example, Sentry)
Built for exceptions. When your code throws, you get the stack trace, the release it shipped in, how many users hit it, and grouping so a thousand identical errors show up as one issue. Sentry has added performance tracing around that core, and it runs across browser, mobile and backend, which matters if one team owns all three.
What it’s best at: “what broke, in which release, for how many people.”
Full APM platforms (for example, Datadog)
Built for breadth: traces, metrics, logs and infrastructure (hosts, containers, databases) in one place, across many languages and services. If you run a polyglot stack on real infrastructure and have someone who owns the platform, nothing on this list covers more ground.
What it’s best at: “how is the whole system behaving, from the request down to the host.”
OpenTelemetry
Not a product. OpenTelemetry is an open standard plus SDKs: you instrument once and send traces, metrics and logs to any backend that speaks it, so you can change vendors without touching application code. The trade-off is assembly. You choose and run the exporter, often a collector, a backend, and the dashboards and alerts on top.
What it’s best at: vendor neutrality and keeping data where you need it, if those are requirements and not just preferences.
Structured logs (Pino or Winston with a request ID)
Cheap, flexible and already half there. Add a request ID to every log line and you can follow one request through your code. Everything else is yours to build: shipping logs somewhere searchable, keeping them long enough, deciding what to log, and making sure tokens and personal data never get written down.
What it’s best at: total control for teams that want to own the plumbing.
The gaps that bite small teams
Each of these tools does its own job well. The trouble is the requests that fall between them.
Abuse that never throws. A bot trying 400 passwords against /login produces 400 401 responses. Your code returned those on purpose, so nothing reaches the error tracker. A scraper paging through /search at 3am looks like healthy traffic until the database pool runs out.
Bodies. Traces tell you a request took 1.8 seconds and which spans were slow. They usually don’t keep what the customer sent or what you answered, and that’s the part you need when the bug is “the export is missing rows.”
Outbound calls. A lot of 500s start one hop away: a payment provider rate limiting you, a data vendor that changed a field. If you don’t record the calls your API makes, you see the symptom and guess at the cause.
Who called. “Something failed for a customer” is only useful if you can filter to that customer’s requests. That means tagging every request with a user or account ID, consistently, everywhere.
Pick by the job, not the logo
| What you need | Start with | Watch out for |
|---|---|---|
| Know when code throws, by release | An error tracker | It won’t show 4xx abuse or bodies |
| Find slow endpoints and what they wait on | APM: a platform, or OpenTelemetry plus a backend | Setup time; who maintains it |
| See who’s hitting the API and what they sent | Request-level logging with bodies, tagged by user | Redacting secrets and PII before storage |
| Block obvious abuse at the app | A WAF or rate limits in front of your routes | Start in monitor mode before you enforce |
| One install, one bill, two people on call | One tool that covers the request log, APM and blocking | Check it supports your framework |
A 2-person team usually needs rows one and three on day one, and row two when the first “it’s slow” ticket arrives. A 20-person team with several services is where a full platform or OpenTelemetry starts to pay for its setup time.
Where ApiTraffic fits
ApiTraffic is a Node SDK that covers rows three to five: every inbound request and the outbound calls it made, with headers and bodies, tagged by user or account; APM spans for the database, cache and outbound work inside each request; and a firewall in front of your routes. Features are switched on from the dashboard and pushed to running servers, so turning on a redaction rule or a firewall policy isn’t a deploy.
It works alongside what you already run:
- Keep your error tracker. ApiTraffic answers “what was the request,” your error tracker answers “what was the exception.”
- Already on OpenTelemetry? Add ApiTraffic’s span processor to your own tracer provider instead of using its preload.
- Running Datadog or New Relic? The APM preload detects them and steps aside.
A setup you can copy
Here’s an Express app with request IDs in the logs, ApiTraffic capturing requests, and the user’s ID tagged so you can filter to one customer.
npm install express pino-http @apitraffic/node
// server.js — start with: node --env-file=.env server.js
// .env holds API_TRAFFIC_TOKEN and API_TRAFFIC_BUCKET
const express = require('express');
const crypto = require('node:crypto');
const pinoHttp = require('pino-http');
const apitraffic = require('@apitraffic/node');

const app = express();

// 1. A request ID on every log line, echoed back to the client
app.use(pinoHttp({
  genReqId: (req, res) => {
    const id = req.headers['x-request-id'] || crypto.randomUUID();
    res.setHeader('x-request-id', id);
    return id;
  },
}));

// 2. Body parsers before ApiTraffic, so the firewall can inspect bodies
app.use(express.json());

// 3. ApiTraffic before your routes
app.use(apitraffic.express());

// 4. Tag who's calling, once, after auth
app.use((req, res, next) => {
  if (req.user) apitraffic.tag('userId', String(req.user.id));
  apitraffic.tag('requestId', String(req.id));
  next();
});

app.get('/v1/exports/:id', async (req, res) => {
  // your handler
});

app.listen(3000);
The request ID ties the two together: a customer can quote it from the response header, you search for it in ApiTraffic, and the same ID is on every Pino log line for that request.
For APM spans, install the OpenTelemetry packages and start the app with the preload:
npm install @opentelemetry/api @opentelemetry/sdk-trace-node @opentelemetry/instrumentation @opentelemetry/auto-instrumentations-node
node --env-file=.env -r @apitraffic/node/register server.js
Redaction. The SDK masks credential headers such as Authorization, Cookie and X-Api-Key, and credential-shaped keys in bodies and query strings, from the first request. Add rules for anything else that’s personal (emails, card numbers, addresses) under Redactions. Rules that run at the API are applied before data leaves your server.
What to alert on, whatever tool you use:
- the 5xx rate on any endpoint, compared with the previous hour
- p95 latency per endpoint after a deploy
- 401 and 403 bursts from a single source
- 429s or errors from a third-party API you depend on
The short version
Error trackers catch exceptions. APM platforms and OpenTelemetry explain the whole system. Logs are yours to shape. Small teams get burned by the requests in between: the 401 bursts, the bodies, the outbound calls, the “which customer was that.” Cover those first, in whatever tool fits your team.
See one request end to end. Start free
Keep reading
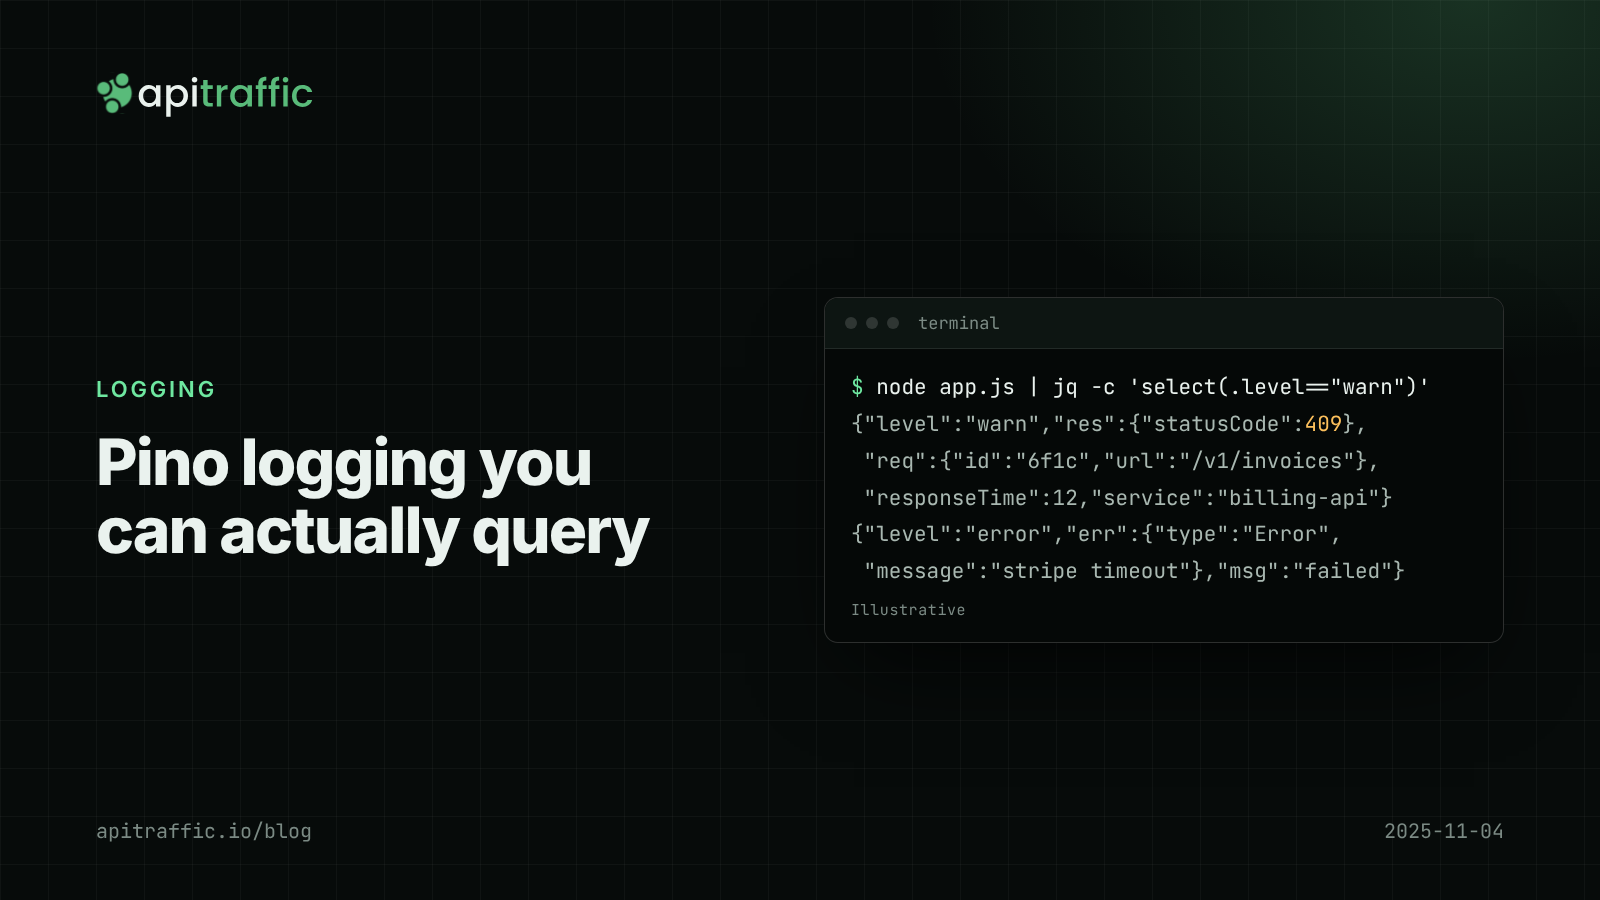
Pino logging in Node.js: a practical structured logging setup for Express and Fastify
A customer says invoices failed yesterday and your logs are a wall of console.log. Set up Pino logging for Express or Fastify in an afternoon: JSON lines, request IDs, levels by status, redaction and a team checklist.

W3C Trace Context in Node.js: correlating requests across services with traceparent
Three services, three log streams, one failed order, and nothing to join them on. W3C Trace Context gives every hop the same trace ID. Here is how to propagate traceparent in Node with OpenTelemetry, or in 30 lines without it.

Third-party API latency: measuring vendor slowness and failures in Node
The vendor status page is green and your checkout is slow. Here is how to measure third-party API latency and failures from your own Node servers, per dependency, without wrapping fetch.