
Fastify monitoring: hooks, metrics and APM for Fastify 4 and 5
Hook timings, route histograms, OpenTelemetry spans and load shedding, each tested on Fastify 5.12 and 4.29.

Fastify monitoring comes down to four measurements: how long each route takes, how often it fails, where the time goes inside a request, and whether the process itself is running out of room. Fastify gives you the first two almost for free through its onResponse hook and reply.elapsedTime. fastify-metrics turns them into Prometheus histograms labelled by route, @fastify/otel breaks each request into spans for every hook and handler, and @fastify/under-pressure watches event loop delay and memory so the server can shed load before it falls over. This guide sets up each one and shows the output.
Tested on Node.js 22.23, Fastify 5.12.8 with fastify-metrics 15.0.1, @fastify/otel 0.21.4 and @fastify/under-pressure 9.2.1, and Fastify 4.29.1 with fastify-metrics 11.0.0. Every code block below was run against those versions, and the output shown is what it printed.
Where to measure in Fastify
Fastify runs every request through a fixed lifecycle of hooks: onRequest, preParsing, preValidation, preHandler, the handler, preSerialization, onSend, then onResponse once the response has been sent. For monitoring, onResponse is the hook you want. It runs after the client has the bytes, so the status code is final and anything you do there adds nothing to the client’s latency.
Two request properties do most of the work:
request.routeOptions.urlis the route pattern Fastify matched, such as/v1/orders/:orderId. Group by this and never by the raw URL, or every order ID becomes its own series.reply.elapsedTimeis the time in milliseconds since Fastify received the request, read at the moment you call it. InsideonResponsethat is the full server-side duration. It replacedreply.getResponseTime(), which was deprecated in Fastify 4 and removed in 5.
const Fastify = require('fastify');
const app = Fastify({ logger: false });

app.addHook('onResponse', async (request, reply) => {
  const route = request.routeOptions.url ?? 'unmatched';
  console.log(JSON.stringify({
    method: request.method,
    route,
    status: reply.statusCode,
    ms: Math.round(reply.elapsedTime * 10) / 10,
  }));
});

app.get('/v1/orders/:orderId', async (request) => {
  await new Promise((r) => setTimeout(r, 40));
  return { id: request.params.orderId };
});

app.get('/v1/fail', async () => { throw new Error('boom'); });
Calling it with app.inject() for two orders, one failing route and one path that does not exist printed:
{"method":"GET","route":"/v1/orders/:orderId","status":200,"ms":44}
{"method":"GET","route":"/v1/orders/:orderId","status":200,"ms":40.9}
{"method":"GET","route":"/v1/fail","status":500,"ms":1.1}
{"method":"GET","route":"unmatched","status":404,"ms":0.4}
The same file gave the same shape of output on Fastify 4.29.1. Note the last line: on a 404, routeOptions.url is undefined, so give unmatched requests one fixed label. Scanners hitting /wp-login.php and /.env would otherwise fill your metrics with junk paths.
If you already log in hooks, our guide to Fastify hooks for logging and auth covers the same lifecycle from the logging side, and Fastify logging with the built-in pino logger goes deeper on request logs.
The encapsulation gotcha
Fastify plugins get their own scope. A hook added inside a plugin applies only to routes registered in that plugin and its children, which is great for auth and confusing for monitoring. This hook looks global, but it only covers the plugin’s own scope:
app.register(async function timing(instance) {
  instance.addHook('onResponse', async (req, reply) => {
    console.log('timed', req.routeOptions.url);
  });
});

app.get('/v1/users', async () => []);
A request to /v1/users printed nothing from the hook. Wrapping the plugin with fastify-plugin breaks the encapsulation so the hook lands on the root instance:
const fp = require('fastify-plugin');

app.register(fp(async function timing(instance) {
  instance.addHook('onResponse', async (req, reply) => {
    console.log('timed', req.routeOptions.url);
  });
}));
That version printed timed /v1/users. Every monitoring plugin in this guide is already wrapped this way, so the rule for them is simpler: register them at the root, before your routes. The Encapsulation reference has the full model.
Fastify metrics with fastify-metrics and Prometheus
Logging durations per request is fine for debugging. For dashboards and alerts you want histograms you can query for p95 and p99 over time. fastify-metrics is the usual choice: it exposes a /metrics endpoint in Prometheus format and records a request duration histogram labelled by method, route and status code.
Pick the major version by Fastify version. On Fastify 5, use fastify-metrics 15 (it needs Node.js 22 or later, because its @prometheus-io/client dependency does). On Fastify 4, use fastify-metrics 11, which is built on prom-client 15.
const Fastify = require('fastify');
const metrics = require('fastify-metrics');

async function build() {
  const app = Fastify();
  await app.register(metrics, {
    endpoint: '/metrics',
    defaultMetrics: { enabled: false },
    routeMetrics: {
      enabled: { histogram: true, summary: false },
      groupStatusCodes: true,
      routeBlacklist: ['/health'],
    },
  });

  app.get('/health', async () => ({ ok: true }));

  app.register(async (orders) => {
    orders.get('/:orderId', async (req) => ({ id: req.params.orderId }));
  }, { prefix: '/v1/orders' });

  return app;
}
After three order requests, one health check and one request to a path that does not exist, the request counter on /metrics held a single series:
http_request_duration_seconds_count{method="GET",route="/v1/orders/:orderId",status_code="2xx"} 3
What that output shows, and the options behind it:
- The route label is the pattern with its prefix. The route was registered as
/:orderIdinside a plugin with a/v1/ordersprefix, and the label is the full/v1/orders/:orderId. - Unknown routes are dropped.
registeredRoutesOnlydefaults totrue, so the 404 never created a series. Keep it that way unless you have a reason to count scanner traffic here. groupStatusCodes: truebuckets 200, 201 and 204 into2xx, which keeps cardinality down. Turn it off if you alert on specific codes like 429.- Health checks are excluded with
routeBlacklist, so a load balancer polling every five seconds doesn’t drag your p50 toward zero. - The summary is turned off. Summaries compute quantiles in the process and can’t be aggregated across instances. Histograms can, and Prometheus computes percentiles from them with
histogram_quantile.
In version 15 the duration comes from reply.elapsedTime by default (routeMetrics.timing: 'elapsedTime'), so it includes onRequest hooks registered before the plugin. Set timing: 'timers' to keep the older behaviour that starts the clock in the plugin’s own onRequest hook.
Before production, lock down /metrics. The endpoint is unauthenticated by default, and it exposes your route names and traffic volumes. The README shows how to pass an onRequest auth hook in the endpoint object or serve the registry from a second Fastify instance bound to 127.0.0.1. And if you add custom labels, routeMetrics.maxSeries caps how many label combinations the plugin will create.
A p95 query per route then looks like this:
histogram_quantile(0.95,
  sum by (le, route) (rate(http_request_duration_seconds_bucket[5m])))
Our post on API latency percentiles explains why p95 and p99 tell you more than the average.
Fastify APM and tracing with @fastify/otel
Metrics tell you that /v1/orders/:orderId got slow. Tracing tells you whether it was the auth hook, the handler or the database call inside it. @fastify/otel is the OpenTelemetry instrumentation maintained by the Fastify team. It creates a span for each request, a child span for the handler, and a child span for each hook, named after the hook function.
When we tested, @fastify/otel 1.0.1 required @opentelemetry/api 1.10, while the current OpenTelemetry SDK packages (2.12.1) accept only versions below 1.10, so npm refused the install with ERESOLVE. The 0.21 line works with @opentelemetry/api 1.9:
npm i @fastify/[email protected] @opentelemetry/[email protected] \
  @opentelemetry/[email protected] @opentelemetry/[email protected]
Check npm view @fastify/otel peerDependencies before you pin, since this will change as the SDK moves to 1.10.
const { NodeTracerProvider } = require('@opentelemetry/sdk-trace-node');
const { SimpleSpanProcessor, InMemorySpanExporter } = require('@opentelemetry/sdk-trace-base');
const FastifyOtelInstrumentation = require('@fastify/otel');

const exporter = new InMemorySpanExporter(); // swap for an OTLP exporter in production
const provider = new NodeTracerProvider({ spanProcessors: [new SimpleSpanProcessor(exporter)] });
provider.register();

const fastifyOtel = new FastifyOtelInstrumentation();
fastifyOtel.setTracerProvider(provider);

const app = require('fastify')();
await app.register(fastifyOtel.plugin()); // before routes and other plugins

app.addHook('preHandler', async function loadUser(request) {
  await new Promise((r) => setTimeout(r, 15)); // pretend auth lookup
});

app.get('/v1/orders/:orderId', async (request) => {
  await new Promise((r) => setTimeout(r, 30));
  return { id: request.params.orderId };
});

app.get('/health', { config: { otel: false } }, async () => 'ok');
One request to the order route and one to /health produced three spans, all from the order request:
preHandler - loadUser                              15.3 ms
handler - fastify -> @fastify/otel                 30.8 ms /v1/orders/:orderId
request                                            48.5 ms /v1/orders/:orderId
The loadUser name comes from the function name, so name your hook functions; anonymous arrow functions show up as fastify -> @fastify/otel, which tells you nothing during an incident. The config: { otel: false } route option skipped /health entirely.
For a full setup, use the OpenTelemetry Node SDK and pass new FastifyOtelInstrumentation({ registerOnInitialization: true }) in its instrumentations array, next to @opentelemetry/instrumentation-http (which the README says you need to propagate traces back upstream) and instrumentations for your database driver. Then point an OTLP exporter at whatever backend you use. The Node.js API monitoring guide covers the collector side.
Fastify performance monitoring: saturation with under-pressure
Request metrics only show a problem once requests are already slow. Saturation metrics show it coming. In Node that mostly means event loop delay (how late timers fire because something is hogging the thread) and memory. @fastify/under-pressure measures both and, when a threshold is crossed, answers new requests with a 503 instead of queuing them behind a blocked loop.
app.register(require('@fastify/under-pressure'), {
  maxEventLoopDelay: 1000,          // ms
  maxEventLoopUtilization: 0.98,
  maxHeapUsedBytes: 1_000_000_000,
  maxRssBytes: 1_500_000_000,
  exposeStatusRoute: '/status',
  pressureHandler: (req, reply, type, value) => {
    req.log.warn({ type, value }, 'under pressure');
    reply.code(503).header('Retry-After', '10').send({ error: 'Service Unavailable' });
  },
});

app.get('/v1/report', async () => {
  const end = Date.now() + 1500;   // simulate a CPU-bound handler
  while (Date.now() < end) {}
  return { ok: true };
});
Against a running server, /v1/ping returned 200 before the CPU-bound request and 503 with Retry-After: 10 right after it. app.memoryUsage() explained why:
{
  eventLoopDelay: 504.09851733333335,
  rssBytes: 71749632,
  heapUsed: 12755760,
  eventLoopUtilized: 0.9998350710190413
}
Event loop utilization was at 0.9998, over the 0.98 limit, so the plugin shed the next request. Each threshold is disabled unless you set it. Count the 503s the plugin sends in your metrics too: a spike in them means you need another instance or a fix for a blocking handler. Our posts on event loop lag and Node.js server timeouts cover what usually causes it.
Fastify monitoring options compared
| Option | What it gives you | Good fit when | Setup |
|---|---|---|---|
onResponse hook + reply.elapsedTime |
Per-request duration, status and route in your logs | You want something today with no new dependencies | A few lines |
| fastify-metrics + Prometheus + Grafana | Route histograms, p95/p99, alerting with Alertmanager | You already run Prometheus or want open-source dashboards | Plugin plus a scrape target |
| @fastify/otel + OpenTelemetry | Spans per hook and handler, vendor-neutral traces | You want tracing you can send to any backend | SDK setup and an exporter |
| @fastify/under-pressure | Event loop and memory checks, load shedding, a status route | Any production Fastify server | One plugin |
| Datadog, New Relic, Elastic APM | Hosted APM with Fastify auto-instrumentation, infra metrics and alerting | You want one hosted platform across many services and languages | Agent or tracer preload |
| Sentry, AppSignal | Error tracking with performance monitoring and Fastify integrations | Error grouping and alerts are the main need | SDK init and a Fastify error handler |
| ApiTraffic | Request and response capture per route, APM spans, firewall | You want the request behind each slow or failed call, plus blocking, in one Node install | One plugin, optional APM preload |
The open-source pieces combine well: many teams run fastify-metrics for dashboards, under-pressure for safety, and OpenTelemetry for traces sent to a hosted backend.
Doing this with ApiTraffic
ApiTraffic is a hosted option for Fastify 4 and 5 on Node.js 20 or later. You register one plugin at the root, first, so its hooks run ahead of the others:
const fastify = require('fastify')({ logger: true });
const apitraffic = require('@apitraffic/node');

fastify.register(apitraffic.fastify()); // reads API_TRAFFIC_TOKEN and API_TRAFFIC_BUCKET
fastify.register(require('./routes/orders'), { prefix: '/v1' });

fastify.listen({ port: 3000 });
It captures each request and response when the reply is sent, grouped by the matched route with its prefix, so /:orderId under /v1/orders shows up as /v1/orders/{orderId}. Outbound calls made with fetch, http or axios are linked to the request that made them. The firewall is mounted as a preHandler hook and is off until you create a policy. For spans, install @apitraffic/apm and start with node -r @apitraffic/node/register ./server.js; if you already run OpenTelemetry, the docs show how to add its span processor to your existing setup instead. From there you get p50, p95 and p99 per endpoint and a comparison against a baseline to find regressions after a deploy. Setup details are in the Fastify integration docs.
FAQ
How do I monitor a Fastify app?
Start with an onResponse hook that records request.routeOptions.url, reply.statusCode and reply.elapsedTime. Add fastify-metrics to expose those as Prometheus histograms, @fastify/under-pressure to watch event loop delay and memory, and @fastify/otel when you need to see time spent inside each hook and handler.
How do I get the response time of a Fastify request?
Read reply.elapsedTime in an onResponse hook. It returns milliseconds since Fastify received the request, and it works on Fastify 4 and 5. The older reply.getResponseTime() was removed in Fastify 5.
Does fastify-metrics work with Fastify 4?
Not the current version. fastify-metrics 12 and later require Fastify 5, and version 14 and later also need Node.js 22. On Fastify 4, install fastify-metrics 11, which we tested on Fastify 4.29.1 with the same configuration as above.
Why do my Fastify hooks not run for some routes?
Encapsulation. A hook added inside a registered plugin only applies to that plugin’s routes. Wrap the plugin with fastify-plugin, or add the hook on the root instance before registering routes.
Is there an OpenTelemetry instrumentation for Fastify?
Yes. @fastify/otel is maintained by the Fastify team and creates spans for requests, handlers and every lifecycle hook. Register its plugin before your routes, or pass it to the OpenTelemetry Node SDK with registerOnInitialization: true. Check its @opentelemetry/api peer range against your SDK version before installing.
For the wider picture across frameworks, see the Node.js API monitoring guide and the Node.js API logging guide.
See what’s hitting your API: apitraffic.io
Keep reading
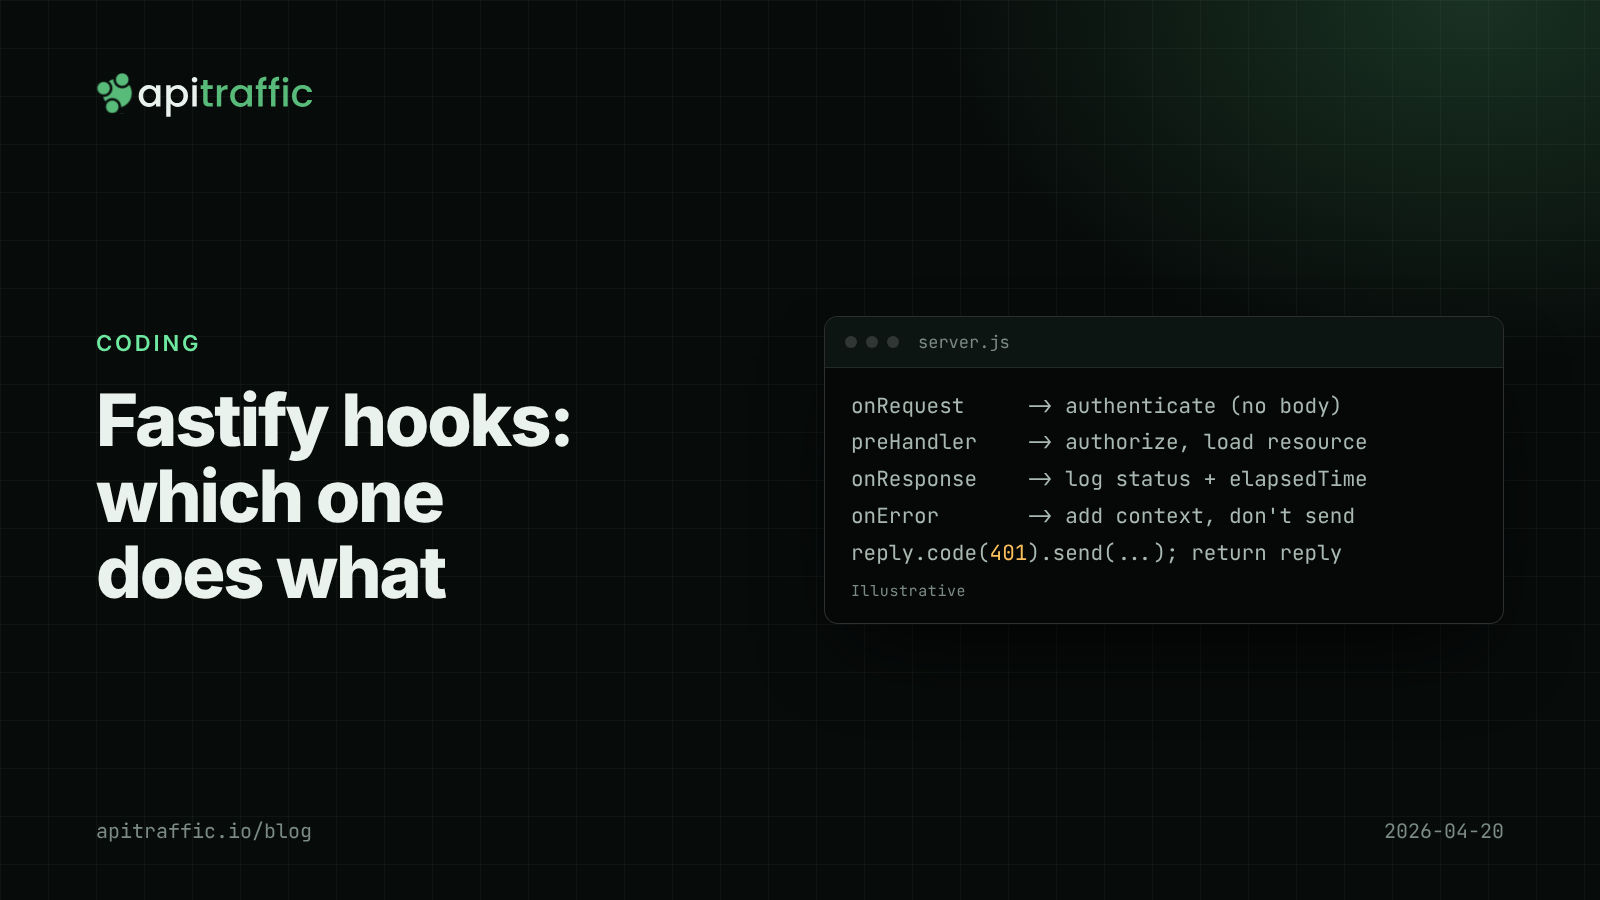
Fastify hooks for logging and auth: onRequest, preHandler and onResponse explained
Auth checks that run before the body exists, log lines missing the status code, handlers that run after a 401: most come from using the wrong Fastify hook. Here is which hook does which job in Fastify v5, with working code.
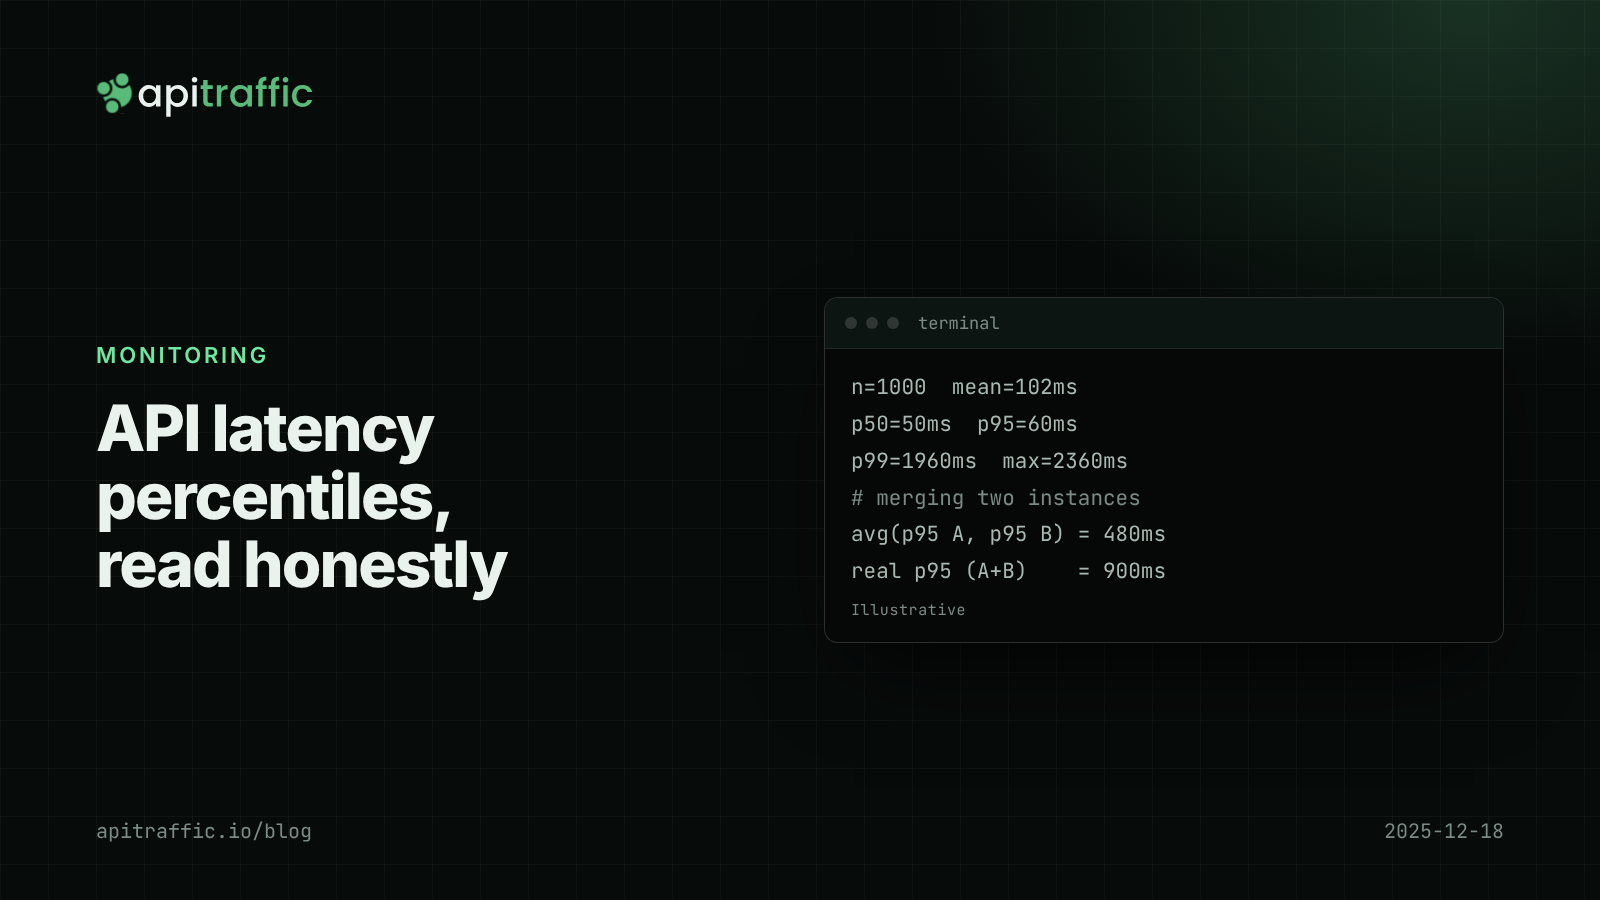
API latency percentiles: how to read p50, p95 and p99 without fooling yourself
Your average latency says 102 ms; a customer says the app hangs for two seconds. Both are true. Learn to read p50, p95 and p99, avoid the four classic mistakes, and record percentiles per route in Node.
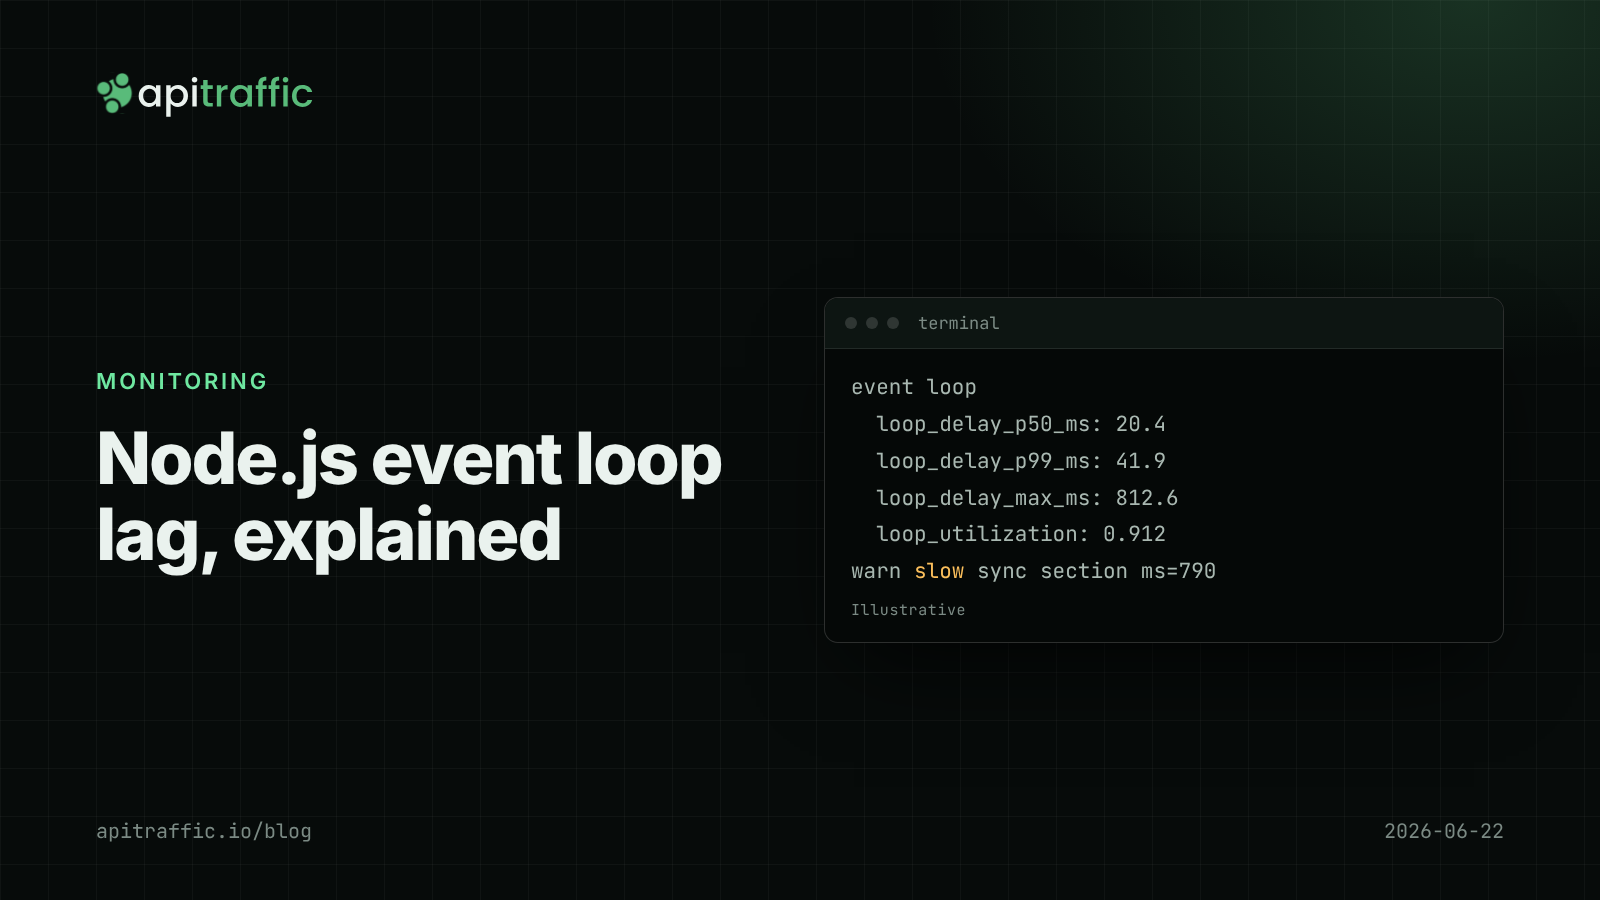
Node.js event loop lag: the metric that explains "random" slowness
Every endpoint slow at once, database fine, CPU looks idle: that is event loop lag. Here is how to measure it in Node with built-in tools and find the code that blocks.