
Koa monitoring and logging: request logs, metrics and APM for Koa 2 and 3
Time every request, log it with its route, and trace it, with every sample tested on Koa 2.16 and Koa 3.3.

Koa monitoring comes down to one middleware at the top of the stack. It times every request, catches errors so the status you record is the status the client got, and labels each request with the @koa/router route pattern instead of the raw URL. Feed that into structured logs (pino), metrics (prom-client) and traces (OpenTelemetry), and you can see which endpoints are slow or failing and find the request behind each problem.
This guide builds that setup step by step. Every code sample was run against Koa 2.16.4 and Koa 3.3.0 with @koa/router 15.7.1 on Node.js 22, and the outputs shown are from those runs. For the wider picture beyond Koa, see the Node.js API monitoring guide and the Node.js API logging guide.
Where Koa monitoring goes in the onion
Koa middleware runs like an onion. Each middleware does some work, calls await next(), and gets control back after everything below it has finished. So the first middleware you register is the only one that sees the whole request: every other middleware, the router and your handler run inside it.
That makes it the place for timing and logging. The first version most people write looks like this:
app.use(async (ctx, next) => {
  const start = performance.now();
  try {
    await next();
  } finally {
    const ms = (performance.now() - start).toFixed(1);
    console.log(`${ctx.method} ${ctx.path} ${ctx.status} ${ms}ms`);
  }
});

router.get('/boom', () => { throw new Error('db down'); });
Calling /boom on both Koa 2 and Koa 3 printed this:
GET /boom 404 0.9ms
client got 500
The log says 404 and the client got a 500. When a handler throws, nothing has set ctx.status yet, so it still holds Koa’s default of 404 when your finally block runs. Koa only turns the error into a 500 later, in its own error handler, after your middleware has already logged. Every crash in your logs and metrics shows up as a “not found.”
The fix is to catch the error in the same middleware, set the status yourself, then record:
const Koa = require('koa');
const { Router } = require('@koa/router');

const app = new Koa();
const router = new Router({ prefix: '/v1' });

app.use(async (ctx, next) => {
  const start = performance.now();
  try {
    await next();
  } catch (err) {
    ctx.status = err.status || 500;
    ctx.body = { error: err.expose ? err.message : 'Internal Server Error' };
    if (ctx.status >= 500) ctx.app.emit('error', err, ctx);
  } finally {
    console.log(JSON.stringify({
      method: ctx.method,
      route: ctx._matchedRoute || 'unmatched',
      status: ctx.status,
      ms: Number((performance.now() - start).toFixed(1)),
    }));
  }
});

app.on('error', (err, ctx) => {
  console.error('app error:', err.message, ctx?.path);
});

router.get('/orders/:id', (ctx) => { ctx.body = { id: ctx.params.id }; });
router.get('/boom', () => { throw new Error('db down'); });
router.get('/nope', (ctx) => ctx.throw(403, 'not your order'));
app.use(router.routes());
app.use(router.allowedMethods());
app.listen(3000);
Output for /v1/orders/42, /v1/boom, /v1/nope and /v1/missing (identical on Koa 2 and 3 apart from timings):
{"method":"GET","route":"/v1/orders/:id","status":200,"ms":1.3}
app error: db down /v1/boom
{"method":"GET","route":"/v1/boom","status":500,"ms":0.4}
{"method":"GET","route":"/v1/nope","status":403,"ms":0.4}
{"method":"GET","route":"unmatched","status":404,"ms":0.3}
Notes on that code:
ctx._matchedRouteis set by@koa/routerand includes the router prefix, so/v1/orders/42is recorded as/v1/orders/:id. Read it infinally, because it doesn’t exist until the router has run. Requests no route matched have no value, hence the'unmatched'fallback.err.exposeis true for 4xx errors created withctx.throw(), so client errors keep their message and a 500 never leaks a stack or database error to the caller.- Once you catch an error yourself, Koa no longer emits its
errorevent for it. Thectx.app.emit('error', err, ctx)line keeps it firing for server errors, so anything listening (an error tracker, an alert) still hears about them.
Koa logging and request logging with pino
console.log with JSON.stringify works, but you want log levels, a request ID on every line, and a logger your handlers can use. koa-pino-logger is a thin wrapper around pino-http that puts a child logger on ctx.log and writes one line per finished request. We covered pino itself in Pino logging in Node.js; here is the Koa wiring, tested with koa-pino-logger 5.0.0, pino-http 11.0.0 and pino 10.4.0:
const { randomUUID } = require('node:crypto');
const Koa = require('koa');
const { Router } = require('@koa/router');
const pinoLogger = require('koa-pino-logger');

const app = new Koa();
app.silent = true; // koa-pino-logger already logs the error
const router = new Router({ prefix: '/v1' });

app.use(pinoLogger({
  genReqId: (req, res) => {
    const id = req.headers['x-request-id'] || randomUUID();
    res.setHeader('x-request-id', id);
    return id;
  },
  // runs when the response finishes, after the router has matched
  customProps: (req) => ({ route: req.route }),
  customLogLevel: (req, res, err) =>
    err || res.statusCode >= 500 ? 'error' : res.statusCode >= 400 ? 'warn' : 'info',
  serializers: {
    req: (req) => ({ id: req.id, method: req.method, url: req.url }),
    res: (res) => ({ statusCode: res.statusCode }),
  },
}));

app.use(async (ctx, next) => {
  try {
    await next();
  } finally {
    ctx.req.route = ctx._matchedRoute || 'unmatched';
  }
});

router.get('/orders/:id', (ctx) => {
  ctx.log.info({ orderId: ctx.params.id }, 'loading order');
  ctx.body = { id: ctx.params.id };
});
router.get('/boom', () => { throw new Error('db down'); });
app.use(router.routes());
app.listen(3000);
Output, with time, pid, hostname and stack traces trimmed for space:
{"level":30,"req":{"id":"req-abc123","method":"GET","url":"/v1/orders/42"},"orderId":"42","msg":"loading order"}
{"level":30,"req":{"id":"req-abc123","method":"GET","url":"/v1/orders/42"},"route":"/v1/orders/:id","res":{"statusCode":200},"responseTime":3,"msg":"request completed"}
{"level":50,"req":{"id":"1906476a-4309-431a-92cc-f42ac330a661","method":"GET","url":"/v1/boom"},"err":{"type":"Error","message":"db down"},"msg":"db down"}
{"level":50,"req":{"id":"1906476a-4309-431a-92cc-f42ac330a661","method":"GET","url":"/v1/boom"},"route":"/v1/boom","res":{"statusCode":500},"err":{"type":"Error","message":"failed with status code 500"},"responseTime":1,"msg":"request errored"}
What the output shows:
- The first request sent
x-request-id: req-abc123, and that ID is on both its lines, including the one written from inside the handler. The second request had no header, so it got a UUID. Echoing the ID back in the response header lets a user or support ticket hand you the exact ID to search for. If the ID needs to reach code that has noctx, see request IDs with AsyncLocalStorage. - pino-http writes the “request completed” line when the response finishes, so the status is the one the client received, even without the catch block from the previous section. That’s also why
customPropscan read the route: it runs at finish time, after the small middleware below the logger has copied_matchedRouteontoctx.req. - A thrown error is logged twice: once by koa-pino-logger’s own catch (with the real error and stack) and once as “request errored.” Without
customLogLevel, that second line is logged atinfolevel (30) in the versions above, which is easy to miss when you filter for errors. - The serializers keep the log lean. pino-http logs every request header by default, including
authorizationandcookie. If you want headers, add pino’sredactoption before shipping logs anywhere; redacting sensitive data in logs covers the paths to mask.
Koa monitoring metrics with prom-client
Logs tell you about one request. Metrics tell you about all of them: request rate, error rate and latency per route, which is what you graph and alert on. prom-client (tested with 15.1.3) gives you a Prometheus endpoint:
const Koa = require('koa');
const { Router } = require('@koa/router');
const client = require('prom-client');

client.collectDefaultMetrics(); // event loop lag, heap, GC, CPU

const httpDuration = new client.Histogram({
  name: 'http_request_duration_seconds',
  help: 'HTTP request duration in seconds',
  labelNames: ['method', 'route', 'status_code'],
  buckets: [0.005, 0.01, 0.025, 0.05, 0.1, 0.25, 0.5, 1, 2.5, 5],
});

const app = new Koa();
const router = new Router({ prefix: '/v1' });

app.use(async (ctx, next) => {
  if (ctx.path === '/metrics') {
    ctx.type = client.register.contentType;
    ctx.body = await client.register.metrics();
    return;
  }
  const end = httpDuration.startTimer();
  try {
    await next();
  } catch (err) {
    ctx.status = err.status || 500;
    ctx.body = { error: err.expose ? err.message : 'Internal Server Error' };
    if (ctx.status >= 500) ctx.app.emit('error', err, ctx);
  } finally {
    end({
      method: ctx.method,
      route: ctx._matchedRoute || 'unmatched',
      status_code: ctx.status,
    });
  }
});

app.on('error', (err) => console.error('app error:', err.message));

router.get('/orders/:id', (ctx) => { ctx.body = { id: ctx.params.id }; });
router.get('/boom', () => { throw new Error('db down'); });
app.use(router.routes());
app.listen(3000);
After three order lookups, one /v1/boom and one unknown path, /metrics contained:
http_request_duration_seconds_count{method="GET",route="/v1/orders/:id",status_code="200"} 3
http_request_duration_seconds_count{method="GET",route="/v1/boom",status_code="500"} 1
http_request_duration_seconds_count{method="GET",route="unmatched",status_code="404"} 1
Use the route pattern for the label, not the path. Label by ctx.path and every order ID becomes its own time series: /v1/orders/1, /v1/orders/2 and so on, until Prometheus runs out of memory. The route pattern keeps it to one series per endpoint, and lumping every 404 under unmatched stops scanners from minting a new series per probed path.
From the histogram you get p50, p95 and p99 per route with histogram_quantile() in PromQL. If you’re unsure which percentile to alert on, API latency percentiles walks through it. In production, serve /metrics on a separate port or put it behind auth, so it isn’t public.
Koa error monitoring with app.on(‘error’)
How errors reach Koa’s error event, per the Koa API docs and the source:
- With no listener of your own, Koa’s default handler prints the stack to stderr, except when
err.statusis 404 orerr.exposeis true (client errors fromctx.throw(4xx)), and except whenapp.silentis true. - Adding
app.on('error', ...)replaces that default output. If your listener doesn’t log, nothing does. - If a middleware catches an error and doesn’t rethrow it, Koa never sees it and emits nothing. That’s why the samples above call
ctx.app.emit('error', err, ctx)for 5xx. - The listener gets
ctxas the second argument, so you can attach the route, request ID or user to whatever you send to an error tracker.
In practice: catch errors in your top middleware, report them from app.on('error'), and keep 4xx out of your error tracker unless you want them there.
Koa APM with OpenTelemetry
Logs and metrics show that /v1/orders/:id got slow. Traces show where the time went, whether that was the database, an outbound API call or your own code. OpenTelemetry’s Koa instrumentation supports koa >=2.0.0 <4 and @koa/router >=8.0.0, so both majors are covered. Tested with @opentelemetry/sdk-node 0.301.2, instrumentation-http 0.301.2 and instrumentation-koa 0.73.0:
// tracing.js: load it before the app with node --require ./tracing.js server.js
const { NodeSDK } = require('@opentelemetry/sdk-node');
const { OTLPTraceExporter } = require('@opentelemetry/exporter-trace-otlp-proto');
const { HttpInstrumentation } = require('@opentelemetry/instrumentation-http');
const { KoaInstrumentation } = require('@opentelemetry/instrumentation-koa');

const sdk = new NodeSDK({
  serviceName: 'orders-api',
  traceExporter: new OTLPTraceExporter(), // OTEL_EXPORTER_OTLP_ENDPOINT, default http://localhost:4318
  instrumentations: [new HttpInstrumentation(), new KoaInstrumentation()],
});
sdk.start();

process.on('SIGTERM', () => sdk.shutdown().finally(() => process.exit(0)));
The file has to load before Koa is required, which is what --require does. On both Koa versions, a request to /v1/orders/42 produced a server span named GET /v1/orders/:id with http.route set to /v1/orders/:id, plus a child span router - /v1/orders/:id with koa.type: router. Plain app.use() middleware gets spans of type middleware as well.
You need somewhere to send the spans: Jaeger or Grafana Tempo if you run your own, or any vendor that accepts OTLP. The HTTP instrumentation also traces outbound calls and adds the W3C traceparent header to them, so one trace follows a request across services. W3C Trace Context in Node explains how that header works.
Koa monitoring tools compared
Everything above is free and self-hosted, which also means you run the log storage and search, Prometheus and a trace backend. The main options for Koa:
| Option | Good at | Koa support | Trade-off |
|---|---|---|---|
| pino + koa-pino-logger | Fast JSON request logs with request IDs | Koa middleware | You store and search the logs yourself; no metrics or traces |
| prom-client + Prometheus/Grafana | Per-route rate, errors and latency; alerting | Any version (your middleware) | Aggregates only, no single-request detail |
| OpenTelemetry | Vendor-neutral traces across services | koa >=2 <4, @koa/router >=8 | Needs a backend and some setup |
| Sentry | Error tracking with stack traces, plus tracing | koaIntegration in the Node SDK |
Error-first; request bodies and traffic analytics aren’t the focus |
| Datadog APM (dd-trace) | Full APM next to infrastructure metrics and logs | koa >=2, fully supported | Agent to run; a broad platform to configure |
| Elastic APM | APM if you already run the Elastic stack | Koa via koa-router or @koa/router >=5.2.0 <14 | Route support stops before @koa/router 14 |
| ApiTraffic | Every request and response with bodies, outbound calls and a firewall in one middleware | Koa 2.13+ and 3 | Hosted; you send request data to a third party (redaction is configurable) |
Many teams combine them: pino for logs, an APM or OpenTelemetry for traces, and Sentry for errors. The Express monitoring and Fastify monitoring guides cover the same choices for those frameworks.
Doing this with ApiTraffic
If you’d rather not assemble the pieces, ApiTraffic’s Node SDK has a Koa middleware. We ran this against Koa 2.16.4 and 3.3.0 with @apitraffic/node 3.1.0:
const Koa = require('koa');
const { Router } = require('@koa/router');
const { bodyParser } = require('@koa/bodyparser');
const apitraffic = require('@apitraffic/node');

const app = new Koa();
const router = new Router({ prefix: '/v1' });

router.get('/orders/:orderId', async (ctx) => {
  apitraffic.tag('customerId', '42');
  ctx.body = { id: ctx.params.orderId };
});

app.use(bodyParser());
app.use(apitraffic.koa()); // after the body parser, before the router
app.use(router.routes());
app.use(router.allowedMethods());
app.listen(3000);
It reads API_TRAFFIC_TOKEN and API_TRAFFIC_BUCKET from the environment. Per the Koa integration docs, it records each request as the client received it, including responses your own error middleware wrote. Routes are grouped by the @koa/router pattern, prefix included, so the example shows up as /v1/orders/{orderId}, and calls your app makes with fetch, axios or http are captured and linked to the request that made them. apitraffic.tag() adds searchable tags such as a customer ID. The same middleware includes the firewall, which stays off until you create a policy, and APM is one more package (@apitraffic/apm) started with node -r @apitraffic/node/register ./server.js.
Order matters here as well: anything mounted above it that answers on its own (a health check, koa-static) isn’t captured, which is usually what you want.
FAQ
How do I log requests in Koa?
Add a logging middleware as the first app.use(), so it wraps everything else. koa-pino-logger writes one JSON line per request with method, URL, status and response time, and puts a logger on ctx.log for your handlers. Add a request ID with genReqId and the route pattern from ctx._matchedRoute so logs are searchable.
Why does my Koa logging middleware show 404 for errors?
When a handler throws, ctx.status still holds Koa’s default 404 while your middleware’s finally block runs. Koa sets the 500 later, in its own error handler. Catch the error in the same middleware and set ctx.status = err.status || 500 before logging, or log on the response’s finish event the way pino-http does.
What is the best APM for Koa?
It depends on what you already run. OpenTelemetry’s Koa instrumentation covers Koa 2 and 3 and sends traces to any OTLP backend. Datadog lists Koa 2 and later as fully supported, Sentry instruments Koa through its Node SDK, and Elastic APM supports Koa through @koa/router below version 14.
Does OpenTelemetry support Koa 3?
Yes. @opentelemetry/instrumentation-koa supports koa >=2.0.0 <4. We ran it against Koa 3.3.0 and it produced route-named server spans (GET /v1/orders/:id) plus router and middleware spans.
How do I get the route pattern instead of the URL in Koa?
@koa/router sets ctx._matchedRoute to the matched pattern, including any router prefix, for example /v1/orders/:id. It’s only set after the router runs, so read it after await next(). Use it for log fields and metric labels so every ID doesn’t become its own series.
See what’s hitting your API: apitraffic.io
Keep reading
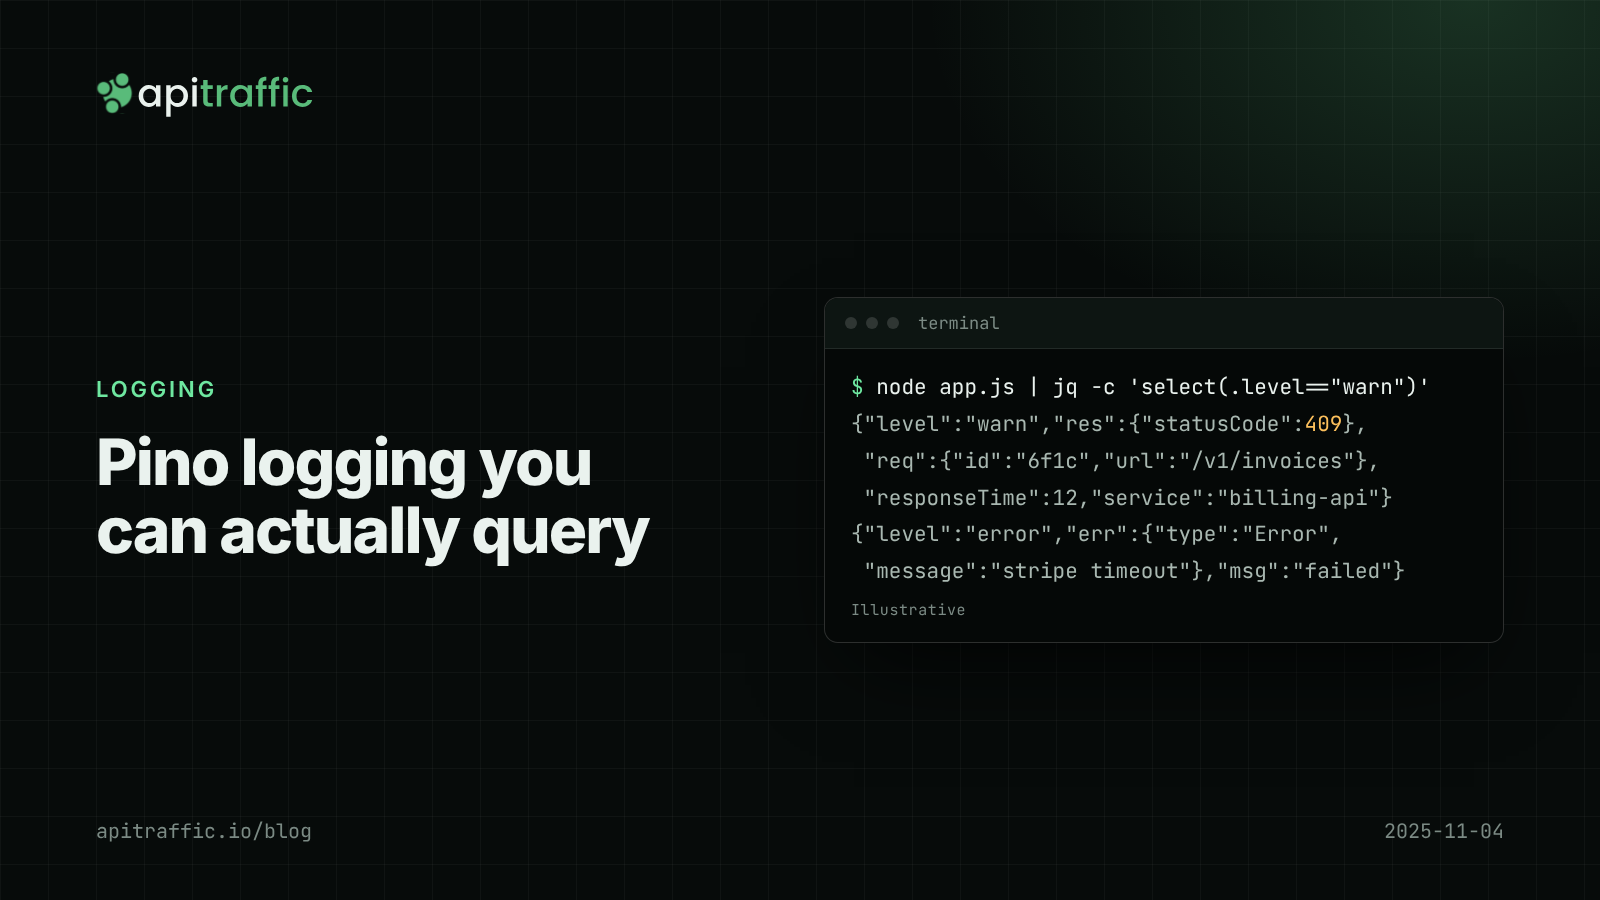
Pino logging in Node.js: a practical structured logging setup for Express and Fastify
A customer says invoices failed yesterday and your logs are a wall of console.log. Set up Pino logging for Express or Fastify in an afternoon: JSON lines, request IDs, levels by status, redaction and a team checklist.
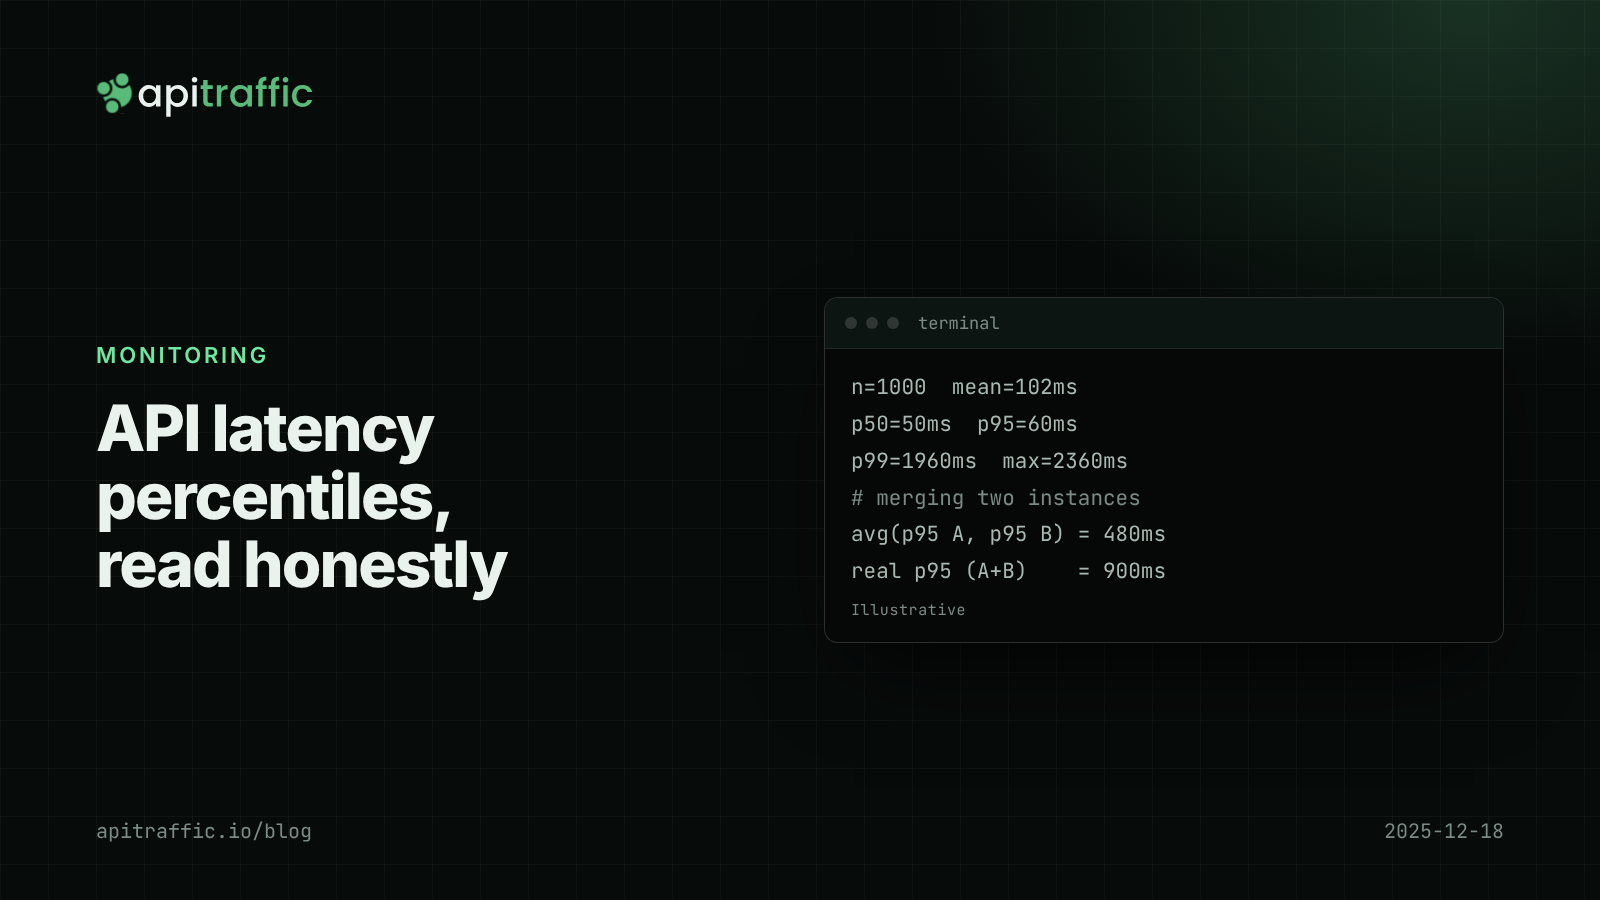
API latency percentiles: how to read p50, p95 and p99 without fooling yourself
Your average latency says 102 ms; a customer says the app hangs for two seconds. Both are true. Learn to read p50, p95 and p99, avoid the four classic mistakes, and record percentiles per route in Node.

W3C Trace Context in Node.js: correlating requests across services with traceparent
Three services, three log streams, one failed order, and nothing to join them on. W3C Trace Context gives every hop the same trace ID. Here is how to propagate traceparent in Node with OpenTelemetry, or in 30 lines without it.