
AdonisJS monitoring and logging: the built-in logger, request logs and APM
Request IDs, a route-pattern request log, metrics, health checks and OpenTelemetry on AdonisJS 7, with real output.

AdonisJS monitoring starts with what the framework already ships: a Pino-based logger with a request ID on every line, an exception handler that reports errors with that ID, and a health checks module. On top of that you add three things: one middleware that logs every request with its route pattern, a metrics or tracing layer (Prometheus or the official @adonisjs/otel package), and an exception handler that stops leaking internal error messages to clients. This guide builds all of it on AdonisJS 7 and shows the real output.
Tested with @adonisjs/core 7.6.0 (http-server 9.3.1, logger 7.1.1 on Pino 10.4.0), @adonisjs/otel 2.0.0 and prom-client 15.1.3, on Node.js 24.22.3. AdonisJS 7 requires Node 24 or later ("engines": { "node": ">=24.0.0" } in @adonisjs/core). We ran every sample on 7 only; on AdonisJS 6, check the v6 docs before copying.
For the framework-agnostic version of this topic, see our guides to Node.js API monitoring and Node.js API logging.
The AdonisJS logger: config, request IDs and HttpContext
The AdonisJS logger is Pino with a config file. The starter kits generate config/logger.ts; the parts worth changing for production are the level, the transport and redaction:
// config/logger.ts
import env from '#start/env'
import app from '@adonisjs/core/services/app'
import { defineConfig, targets } from '@adonisjs/core/logger'

const loggerConfig = defineConfig({
  default: 'app',
  loggers: {
    app: {
      enabled: true,
      name: env.get('APP_NAME'),
      level: env.get('LOG_LEVEL'),
      redact: {
        paths: ['password', '*.password', 'headers.authorization', 'headers.cookie'],
        censor: '[redacted]',
      },
      transport: {
        targets: targets()
          .pushIf(!app.inProduction, targets.pretty())
          .pushIf(app.inProduction, targets.file({ destination: 1 }))
          .toArray(),
      },
    },
  },
})

export default loggerConfig

declare module '@adonisjs/core/types' {
  export interface LoggersList extends InferLoggers<typeof loggerConfig> {}
}
In production this writes one JSON object per line to stdout (destination: 1), which is what most log shippers expect. The redact block is plain Pino: a route that logs request.all() on a login came out as "body":{"email":"[email protected]","password":"[redacted]"}. Our post on redacting sensitive data from logs covers which paths to list.
Request IDs need one flag in config/app.ts:
// config/app.ts
export const http = defineConfig({
  generateRequestId: true,
  // ...
})
With that set, ctx.logger is a child logger bound to the request, so anything you log from a controller carries the ID with no extra code:
router.get('/orders/:id', async ({ params, logger, response }) => {
  logger.info({ orderId: params.id }, 'loading order')
  return response.ok({ id: params.id })
})
{"level":30,"time":1794522144943,"pid":1008,"hostname":"vm","name":"orders-api","request_id":"cc2f3336-2dc8-466a-a777-abfb16af91d3","orderId":"42","msg":"loading order"}
The response also gets an x-request-id header with the same value, so a support ticket with that header leads straight to the log lines. One detail from the source: request.id() reuses an incoming x-request-id header when the client sends one. We sent x-request-id: client-supplied-123 and every log line for that request carried it. That’s what you want behind a proxy that sets the header, and it means you shouldn’t treat the ID as anything more than a correlation key. If you need the ID outside the request (a service, a job queued from a controller), our AsyncLocalStorage request ID post shows the pattern.
AdonisJS request logging middleware with the route pattern
AdonisJS doesn’t log requests by default. A server middleware does it in about twenty lines, and using the route pattern (/api/v1/orders/:id) instead of the raw URL is what makes the logs groupable:
// app/middleware/request_logger_middleware.ts
import type { HttpContext } from '@adonisjs/core/http'
import type { NextFn } from '@adonisjs/core/types/http'

export default class RequestLoggerMiddleware {
  async handle(ctx: HttpContext, next: NextFn) {
    const start = process.hrtime.bigint()

    ctx.response.response.once('finish', () => {
      const ms = Number(process.hrtime.bigint() - start) / 1e6
      const status = ctx.response.response.statusCode
      const level = status >= 500 ? 'error' : status >= 400 ? 'warn' : 'info'

      ctx.logger[level](
        {
          method: ctx.request.method(),
          route: ctx.route?.pattern ?? null,
          url: ctx.request.url(),
          status,
          ms: Math.round(ms * 10) / 10,
        },
        'request completed'
      )
    })

    await next()
  }
}
Register it in server.use() in start/kernel.ts, not router.use(). Router middleware only runs for matched routes, so the 404s from scanners would never be logged. Here’s a 200, a 500 and a probe for /wp-login.php:
{"level":30,"request_id":"cc2f3336-...","method":"GET","route":"/api/v1/orders/:id","url":"/api/v1/orders/42","status":200,"ms":5.6,"msg":"request completed"}
{"level":50,"request_id":"4868f4a9-...","method":"GET","route":"/api/v1/orders/:id","url":"/api/v1/orders/boom","status":500,"ms":3.8,"msg":"request completed"}
{"level":40,"request_id":"35c64797-...","method":"GET","route":null,"url":"/wp-login.php","status":404,"ms":1.4,"msg":"request completed"}
(Lines trimmed: time, pid, hostname and name removed, request IDs shortened.)
We listen for the Node response’s finish event so the timing covers writing the body. We also checked the simpler version: a middleware that logs after await next() saw status 500 for a throwing route, because the exception handler has already rendered the response by the time the server middleware chain unwinds. Either works for status codes. Route groups are included in the pattern, so .prefix('/api/v1') shows up as /api/v1/orders/:id.
Metrics and health checks
Logs answer “what happened to this request”. Metrics answer “is p95 latency on this route getting worse”. The smallest setup is prom-client and a second server middleware that records a histogram labeled by route pattern:
// app/middleware/metrics_middleware.ts
import client from 'prom-client'
import type { HttpContext } from '@adonisjs/core/http'
import type { NextFn } from '@adonisjs/core/types/http'

export const registry = new client.Registry()
client.collectDefaultMetrics({ register: registry })

const duration = new client.Histogram({
  name: 'http_server_request_duration_seconds',
  help: 'HTTP request duration by route pattern',
  labelNames: ['method', 'route', 'status'],
  buckets: [0.01, 0.05, 0.1, 0.25, 0.5, 1, 2.5, 5],
  registers: [registry],
})

export default class MetricsMiddleware {
  async handle(ctx: HttpContext, next: NextFn) {
    const end = duration.startTimer()
    ctx.response.response.once('finish', () => {
      end({
        method: ctx.request.method(),
        route: ctx.route?.pattern ?? 'unmatched',
        status: String(ctx.response.response.statusCode),
      })
    })
    await next()
  }
}
Unmatched requests get the label unmatched instead of their URL, so a scanner trying ten thousand paths can’t blow up your label cardinality. Expose the registry behind a token:
// start/routes.ts
router.get('/metrics', async ({ request, response }) => {
  if (request.header('authorization') !== `Bearer ${process.env.METRICS_TOKEN}`) {
    return response.unauthorized({ message: 'Unauthorized' })
  }
  response.header('content-type', registry.contentType)
  return registry.metrics()
})
http_server_request_duration_seconds_count{method="GET",route="/api/v1/orders/:id",status="200"} 2
http_server_request_duration_seconds_count{method="GET",route="/api/v1/orders/:id",status="500"} 1
http_server_request_duration_seconds_count{method="GET",route="unmatched",status="404"} 1
If you’d rather not write this yourself, the community package @julr/adonisjs-prometheus (2.1.0, AdonisJS 7) wraps it. Our post on API latency percentiles covers what to alert on once the histogram exists.
For health, AdonisJS ships health checks in @adonisjs/core/health:
// start/health.ts
import { HealthChecks, DiskSpaceCheck, MemoryHeapCheck } from '@adonisjs/core/health'

export const healthChecks = new HealthChecks().register([
  new DiskSpaceCheck(),
  new MemoryHeapCheck().warnWhenExceeds('250 mb').failWhenExceeds('300 mb'),
])
// app/controllers/health_checks_controller.ts
import { healthChecks } from '#start/health'
import type { HttpContext } from '@adonisjs/core/http'

export default class HealthChecksController {
  async handle({ response }: HttpContext) {
    const report = await healthChecks.run()
    if (report.isHealthy) {
      return response.ok(report)
    }
    return response.serviceUnavailable(report)
  }
}
Our test sandbox’s disk was 88% full, so the endpoint answered 503 on its first run:
{"isHealthy":false,"status":"error","checks":[{"name":"Disk space check","message":"Disk usage is 88%, which is above the threshold of 80%","status":"error","meta":{"sizeInPercentage":{"used":88,"failureThreshold":80,"warningThreshold":75}}},{"name":"Memory heap check","message":"Heap usage is under defined thresholds","status":"ok"}]}
That’s the default DiskSpaceCheck (warn at 75%, fail at 80%) doing its job, and a reminder to decide which checks should take an instance out of a load balancer. A full disk should; a slow third-party API usually shouldn’t. Our Node.js health check guide goes through liveness versus readiness.
Exception handler logging (and the message leak)
The exception handler in app/exceptions/handler.ts reports errors through ctx.logger: 5xx at error with the full err object, 4xx at warn, plus an x-request-id field. By default it skips 400, 401 and 422, route-not-found and E_HTTP_EXCEPTION errors, so 404s and validation failures don’t flood the error log.
Add the route to every error report by overriding context(), and check what a 500 sends to the client. With NODE_ENV=production and debug off, a route that threw new Error('connect ECONNREFUSED 10.0.3.7:5432') answered a JSON request with:
{"message":"connect ECONNREFUSED 10.0.3.7:5432"}
The default renderer sends error.message as is, so an internal IP and port went out in a public response. This handler keeps the full error in the log and gives the client a generic message with the request ID:
// app/exceptions/handler.ts
import app from '@adonisjs/core/services/app'
import { HttpContext, ExceptionHandler } from '@adonisjs/core/http'

export default class HttpExceptionHandler extends ExceptionHandler {
  protected debug = !app.inProduction

  protected context(ctx: HttpContext) {
    return {
      ...super.context(ctx),
      method: ctx.request.method(),
      route: ctx.route?.pattern ?? null,
    }
  }

  async handle(error: unknown, ctx: HttpContext) {
    const status = (error as { status?: number })?.status ?? 500
    if (status >= 500 && !this.debug) {
      return ctx.response.status(status).send({
        message: 'Internal server error',
        requestId: ctx.request.id(),
      })
    }
    return super.handle(error, ctx)
  }
}
The client now gets {"message":"Internal server error","requestId":"4868f4a9-1c11-4839-b6c9-75db95201f80"}, and the log has the rest (stack trimmed):
{"level":50,"request_id":"4868f4a9-1c11-4839-b6c9-75db95201f80","err":{"type":"Error","message":"connect ECONNREFUSED 10.0.3.7:5432","stack":"Error: connect ECONNREFUSED 10.0.3.7:5432 ...","status":500},"x-request-id":"4868f4a9-1c11-4839-b6c9-75db95201f80","method":"GET","route":"/api/v1/orders/:id","msg":"connect ECONNREFUSED 10.0.3.7:5432"}
Use ignoreStatuses and ignoreCodes on the same class to silence errors you expect, and keep 4xx errors you throw yourself as warn so they don’t page anyone.
AdonisJS APM with OpenTelemetry
For tracing, AdonisJS has an official OpenTelemetry integration, @adonisjs/otel. node ace add @adonisjs/otel creates otel.ts and config/otel.ts, imports otel.ts first in bin/server.ts, and registers a provider and a router middleware. The config is short:
// config/otel.ts
import { defineConfig } from '@adonisjs/otel'
import env from '#start/env'

export default defineConfig({
  serviceName: env.get('APP_NAME'),
  serviceVersion: env.get('APP_VERSION'),
  environment: env.get('APP_ENV'),
})
With debug: true added, it printed each span to the console. The HTTP span is named after the route pattern and carries http.route and http.response.status_code:
name: 'GET /api/v1/orders/:id',
traceId: '322922d539640628626eaed2d5a7d91d',
attributes: {
  'http.request.method': 'GET',
  'url.path': '/api/v1/orders/42',
  'http.route': '/api/v1/orders/:id',
  'http.response.status_code': 200
}
The bundled Pino instrumentation also added trace_id and span_id to the same request’s log lines, next to request_id:
{"level":30,"request_id":"223d3e79-a06b-43fe-96ff-4ac88c4945c2","trace_id":"322922d539640628626eaed2d5a7d91d","span_id":"47bba6f51f25ad83","trace_flags":"01","orderId":"42","msg":"loading order"}
So you can jump from a slow trace to its logs and back. By default it exports over OTLP to whatever collector or backend you point it at (Grafana Tempo, Jaeger, Honeycomb and most vendors accept OTLP). To turn it off without removing it, start the process with OTEL_SDK_DISABLED=true; per the package README, setting it in .env is too late, because .env loads after the SDK starts. For propagating trace context across services, see W3C Trace Context in Node.
Comparing AdonisJS monitoring options
| Option | Good at | You still need |
|---|---|---|
| Built-in logger + request middleware | Free, already installed, JSON lines with request IDs | Somewhere to ship, search and keep the logs |
@adonisjs/otel |
Official tracing, metrics and log correlation over OTLP | A collector or tracing backend |
Prometheus + Grafana (prom-client or @julr/adonisjs-prometheus) |
Cheap, long-lived metrics and alerting by route | Logs or traces for per-request detail |
Sentry (@sentry/node) |
Error grouping, releases and alerting on new errors | Request logs for non-error traffic |
| Datadog, New Relic (Node agents) | Hosted APM, dashboards and alerting in one product | Budget for a commercial agent |
| Apitally | AdonisJS SDK for API metrics, request logs and uptime alerts | To opt in if you want request headers and bodies captured |
ApiTraffic (@apitraffic/adonisjs) |
Request and response log, APM spans and a firewall from one package | A Node.js API (it’s Node only) |
Doing this with ApiTraffic
ApiTraffic has an AdonisJS package for AdonisJS 6 and 7. node ace add @apitraffic/adonisjs writes config/apitraffic.ts, registers the provider, and adds two middleware to start/kernel.ts:
// start/kernel.ts
server.use([
  () => import('@apitraffic/adonisjs/apitraffic_middleware'),
  // ...your server middleware
])

router.use([
  () => import('@adonisjs/core/bodyparser_middleware'),
  () => import('@apitraffic/adonisjs/firewall_middleware'),
])
Because the capture middleware runs first in server.use(), it records every request: ones a server middleware answers itself, ones auth refuses, 404s and requests whose handler throws, each with its final status. The matched route goes along with each request, group prefixes included, so /api/v1/orders/:id shows up as the endpoint /api/v1/orders/{id}. tag('accountId', ...) from @apitraffic/adonisjs makes a request searchable by your own fields, and @apitraffic/apm adds database, cache and fetch spans inside each request. The firewall is switched on from your ApiTraffic account. See what’s hitting your API: apitraffic.io
FAQ
Does AdonisJS log requests by default?
No. The logger is configured out of the box and ctx.logger adds the request ID to whatever you log, but nothing writes a line per request. Add a server middleware like the one above, registered in server.use() so unmatched routes are logged too.
How do I add a request ID to AdonisJS logs?
Set generateRequestId: true in the http export of config/app.ts. ctx.logger then includes request_id on every line, the response gets an x-request-id header, and the exception handler includes the ID in error reports. An incoming x-request-id header is reused if present.
What logger does AdonisJS use?
Pino. @adonisjs/core 7.6.0 ships @adonisjs/logger 7.1.1 on Pino 10.4.0, so Pino options such as redact work in config/logger.ts, and pino-pretty is used for the development transport.
How do I add APM to an AdonisJS app?
Install @adonisjs/otel with node ace add @adonisjs/otel and point it at an OTLP backend, or use a vendor agent. Both need to load before your app code, which is why the OTel setup imports otel.ts first in bin/server.ts.
Why does my AdonisJS API return the raw error message on a 500?
The default exception handler sends error.message in production when debug is off. Override handle() to send a generic message and the request ID for 5xx errors, and keep the details in the log.
Keep reading
AsyncLocalStorage request IDs: follow one request through a Node.js API
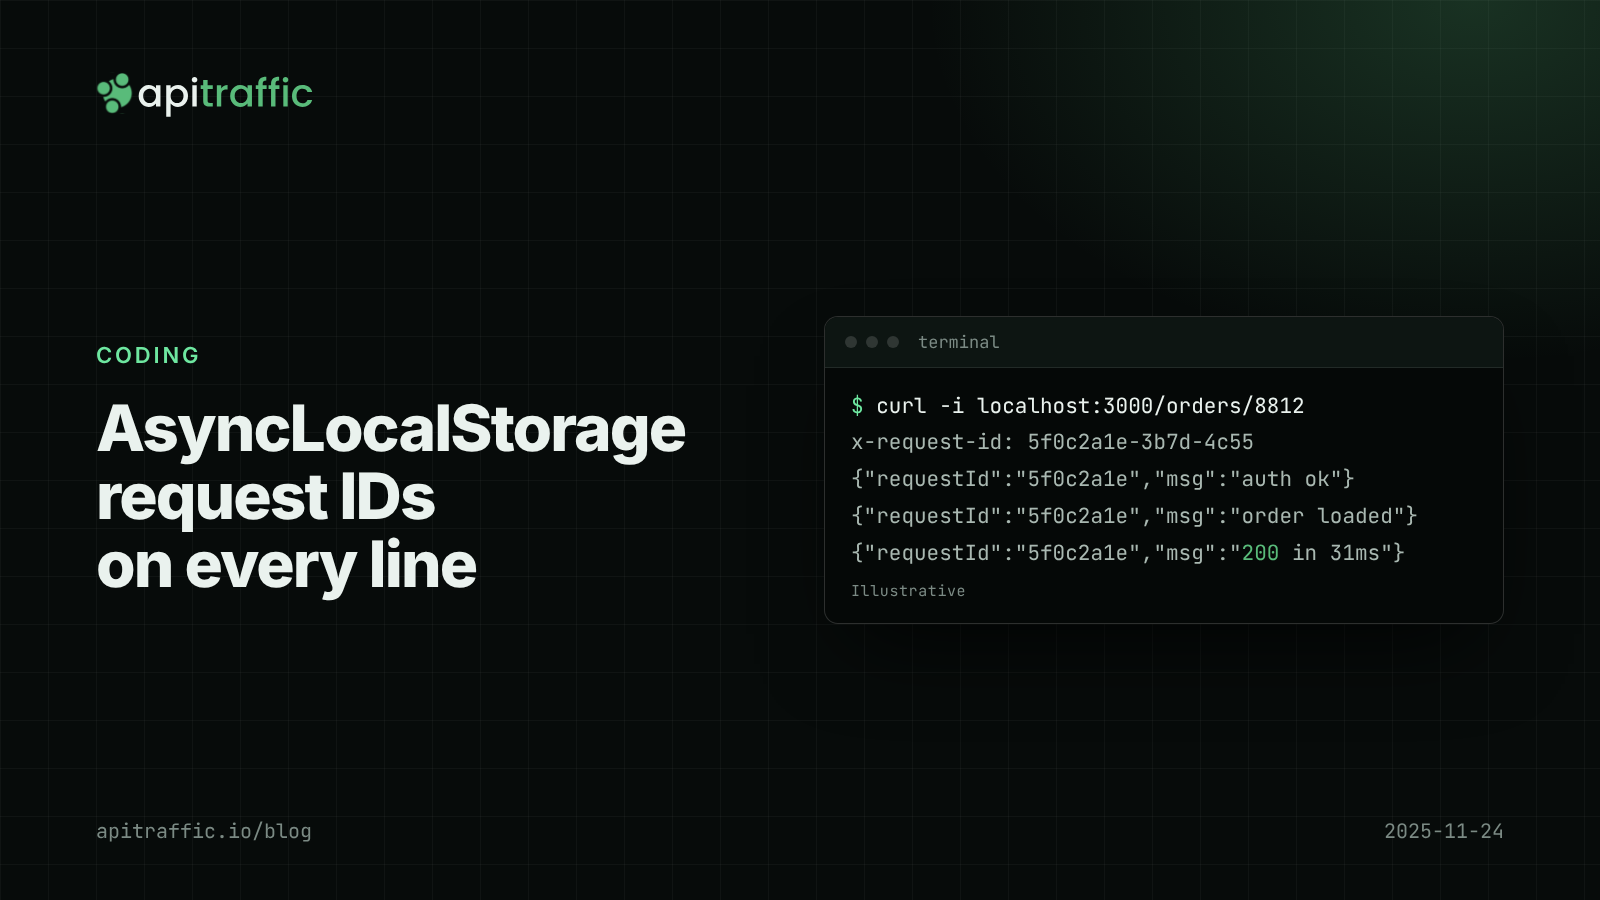
A customer says checkout failed at 2pm and your logs are fifty requests interleaved. Add request IDs with AsyncLocalStorage in Express or Fastify in an afternoon, and every log line, response and downstream call carries the same ID.

Node.js health checks that tell the truth: liveness vs readiness
A database blip should not restart every replica of your API. Split /health into liveness and readiness, with Express and Fastify code you can ship today.

W3C Trace Context in Node.js: correlating requests across services with traceparent
Three services, three log streams, one failed order, and nothing to join them on. W3C Trace Context gives every hop the same trace ID. Here is how to propagate traceparent in Node with OpenTelemetry, or in 30 lines without it.