
UV_THREADPOOL_SIZE in Node.js: when DNS lookups, crypto and fs wait in the same line
Four threads handle DNS lookups, password hashing, file reads and gzip. Spot the queue, then size the pool.
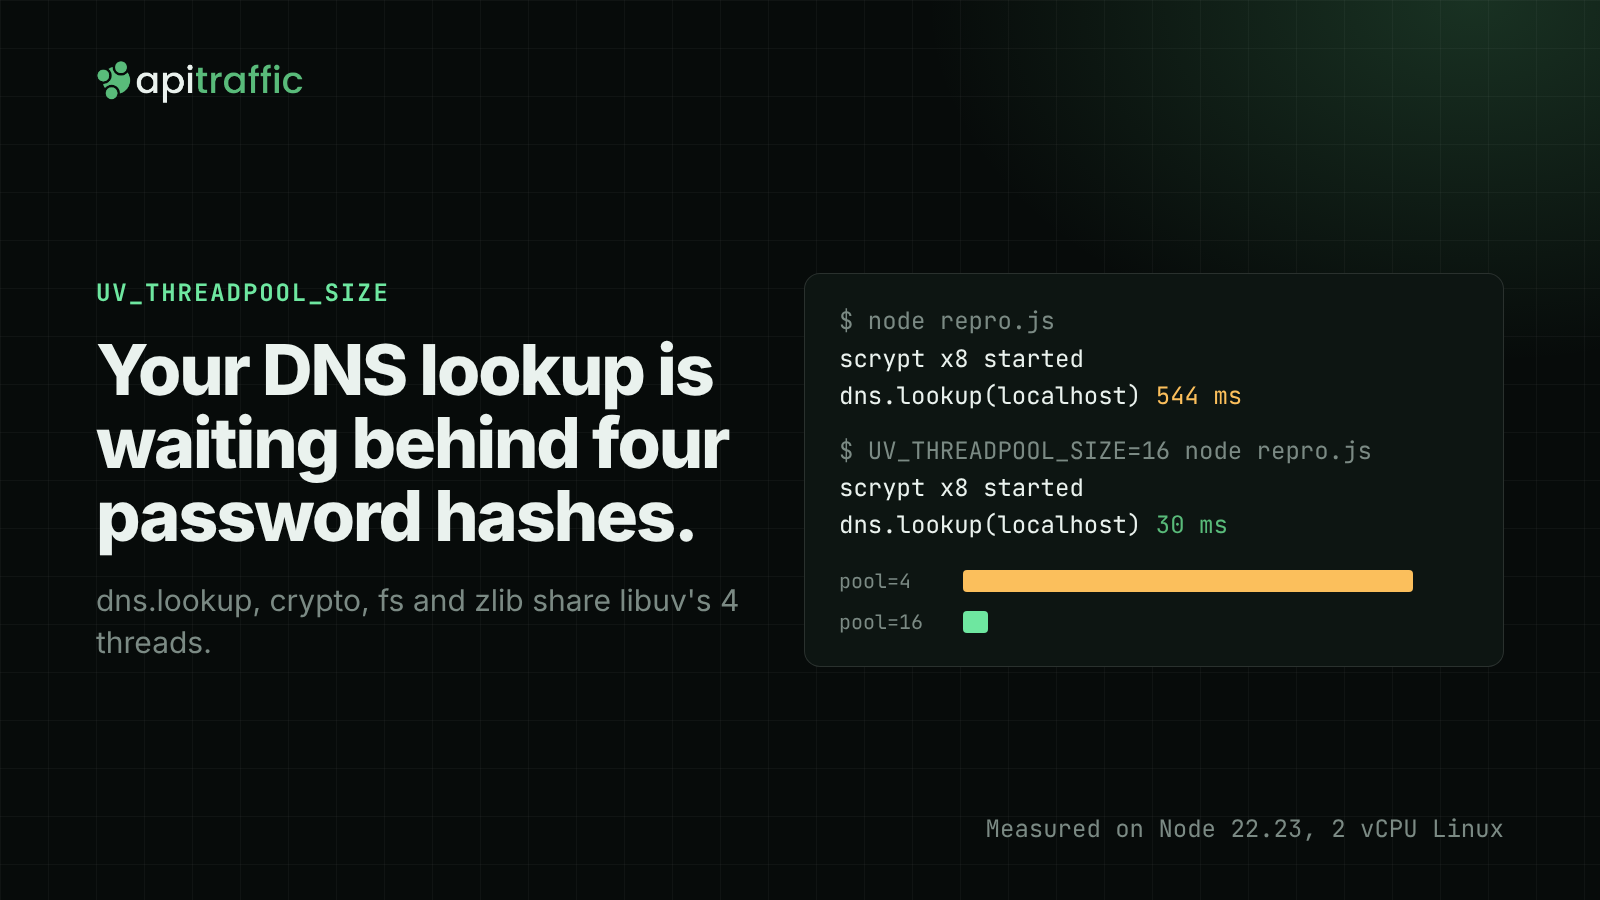
A burst of logins hits your API. Each one hashes a password with crypto.scrypt. At the same moment, every fetch to your payment provider gets slower, and the extra time shows up before the request is even sent. CPU isn’t pegged. Event loop delay looks normal. The payment API’s status page is green.
They’re waiting in line for libuv’s threadpool.
What runs on libuv’s threadpool
Node runs JavaScript on one thread, but some work that has no non-blocking OS interface is handed to a pool of worker threads. That pool has 4 threads by default. The Node CLI docs for UV_THREADPOOL_SIZE list what uses it:
- all
fsAPIs, except file watchers and the explicitly synchronous ones - async crypto:
crypto.pbkdf2(),crypto.scrypt(),crypto.randomBytes(),crypto.randomFill(),crypto.generateKeyPair() dns.lookup()- all
zlibAPIs, except the explicitly synchronous ones
dns.lookup() is the one that surprises people. The dns docs’ implementation considerations explain that it is a synchronous call to getaddrinfo(3) running on the threadpool, and that various networking APIs call it internally to resolve host names. http.request, https.request and the sockets under fetch resolve hosts this way by default. So when four password hashes hold all four threads, the next DNS lookup for api.payments.example sits behind them, and so does the outbound call that needs it.
Reproduce it in 20 lines
// repro.js
const crypto = require('node:crypto');
const dns = require('node:dns');

const start = performance.now();
const ms = () => (performance.now() - start).toFixed(0);

// Eight password hashes: each one holds a threadpool thread while it runs
for (let i = 0; i < 8; i++) {
  crypto.scrypt('correct horse', `salt${i}`, 64, { N: 2 ** 16, r: 8, p: 1, maxmem: 128 * 1024 * 1024 }, () => {
    console.log(`scrypt ${i} done at ${ms()} ms`);
  });
}

// One DNS lookup, started at the same moment
dns.lookup('localhost', (err, address) => {
  console.log(`dns.lookup(localhost) -> ${address} at ${ms()} ms`);
});
Run it twice:
node repro.js
UV_THREADPOOL_SIZE=16 node repro.js
On Node 22.23 on a 2-vCPU Linux machine, the lookup for localhost (which never leaves the box) finished at 544 ms with the default pool, right after the fifth hash freed a thread. With UV_THREADPOOL_SIZE=16 it finished at 30 ms.
The hashes didn’t get faster. All eight finished between roughly 520 and 670 ms in both runs, because two cores can only hash so much at once. A bigger pool stops short tasks from waiting behind long ones. It doesn’t add CPU.
Measure it in production
In production you want numbers per upstream host, with lookup and connect time logged apart from total response time. If connect time climbs while the upstream’s own response time stays flat, the wait is on your side.
For node:http and node:https, a new socket emits lookup and connect events. For fetch, Node’s bundled undici publishes connection events on diagnostics channels (marked experimental in the undici docs; the built-in fetch on Node 22 publishes them).
const dc = require('node:diagnostics_channel');

// fetch (undici): time from "about to connect" to "connected" (lookup, TCP and TLS)
const pending = new Map(); // "host:port" -> start times, oldest first
const key = (p) => `${p.hostname}:${p.port}`;
dc.subscribe('undici:client:beforeConnect', ({ connectParams }) => {
  const k = key(connectParams);
  pending.set(k, [...(pending.get(k) ?? []), performance.now()]);
});
dc.subscribe('undici:client:connected', ({ connectParams }) => {
  const t = pending.get(key(connectParams))?.shift();
  if (t !== undefined) {
    logger.info({ client: 'fetch', host: connectParams.hostname, connectMs: Math.round(performance.now() - t) });
  }
});

// node:http / node:https: lookup and connect on new sockets
function timeSocket(req, host) {
  const t0 = performance.now();
  req.on('socket', (socket) => {
    if (!socket.connecting) return; // reused keep-alive socket: no lookup, no connect
    const timing = { client: 'http', host };
    socket.once('lookup', () => { timing.lookupMs = Math.round(performance.now() - t0); });
    socket.once('connect', () => {
      timing.connectMs = Math.round(performance.now() - t0);
      logger.info(timing);
    });
  });
}
Group by host and watch the p95. A lookup that takes hundreds of milliseconds for a host your resolver has cached points at the pool.
Fixes, in order
1. Set UV_THREADPOOL_SIZE before Node starts
The CLI docs warn that setting process.env.UV_THREADPOOL_SIZE from inside the process is not guaranteed to work, because the pool may already exist by the time your code runs. Put it in the environment:
ENV UV_THREADPOOL_SIZE=16
or in your process manager’s env block. The libuv threadpool docs put the maximum at 1024 (raised from 128 in libuv 1.30.0). Size it to the work that blocks on I/O, like lookups and file reads. CPU-heavy hashing gains nothing from threads beyond your core count.
2. Reuse connections
A kept-alive socket skips the lookup and the handshake. Node’s default HTTP agent has used keep-alive since Node 19, and fetch pools connections per origin. Check that nothing in your code creates a fresh agent or client per request.
3. Cache lookups for hot upstreams
http.Agent accepts a custom lookup function, so a small cache in front of dns.lookup (or a package such as cacheable-lookup) keeps hot hosts off the pool. dns.resolve4() doesn’t use the threadpool at all, but it skips /etc/hosts, so test it before swapping it in.
4. Take load off the pool
Keep password hashing cost at what your security policy needs, and let your reverse proxy or CDN handle gzip instead of zlib in Node.
Checklist
- [ ] List what uses the pool in your app:
fs, async crypto,dns.lookup(every outbound HTTP call to a new host),zlib - [ ]
UV_THREADPOOL_SIZEset in the Dockerfile or process manager, not in app code - [ ] Outbound logs carry lookup and connect time per host, separate from response time
- [ ] One shared agent or client per upstream, with keep-alive on
- [ ] Hashing and compression costs reviewed against the size of the pool
If you’re already reworking login hashing to stop user enumeration, run the repro above with your real hashing parameters first.
Doing this with ApiTraffic
The ApiTraffic SDK records the outbound calls your app makes with fetch and http/https, with their timing, and a call made while handling a request appears as an http.out span in that request’s waterfall (outbound requests docs). When a login burst slows your payment calls, the slow span sits next to the request that waited on it. See what’s slowing your API: apitraffic.io
Keep reading
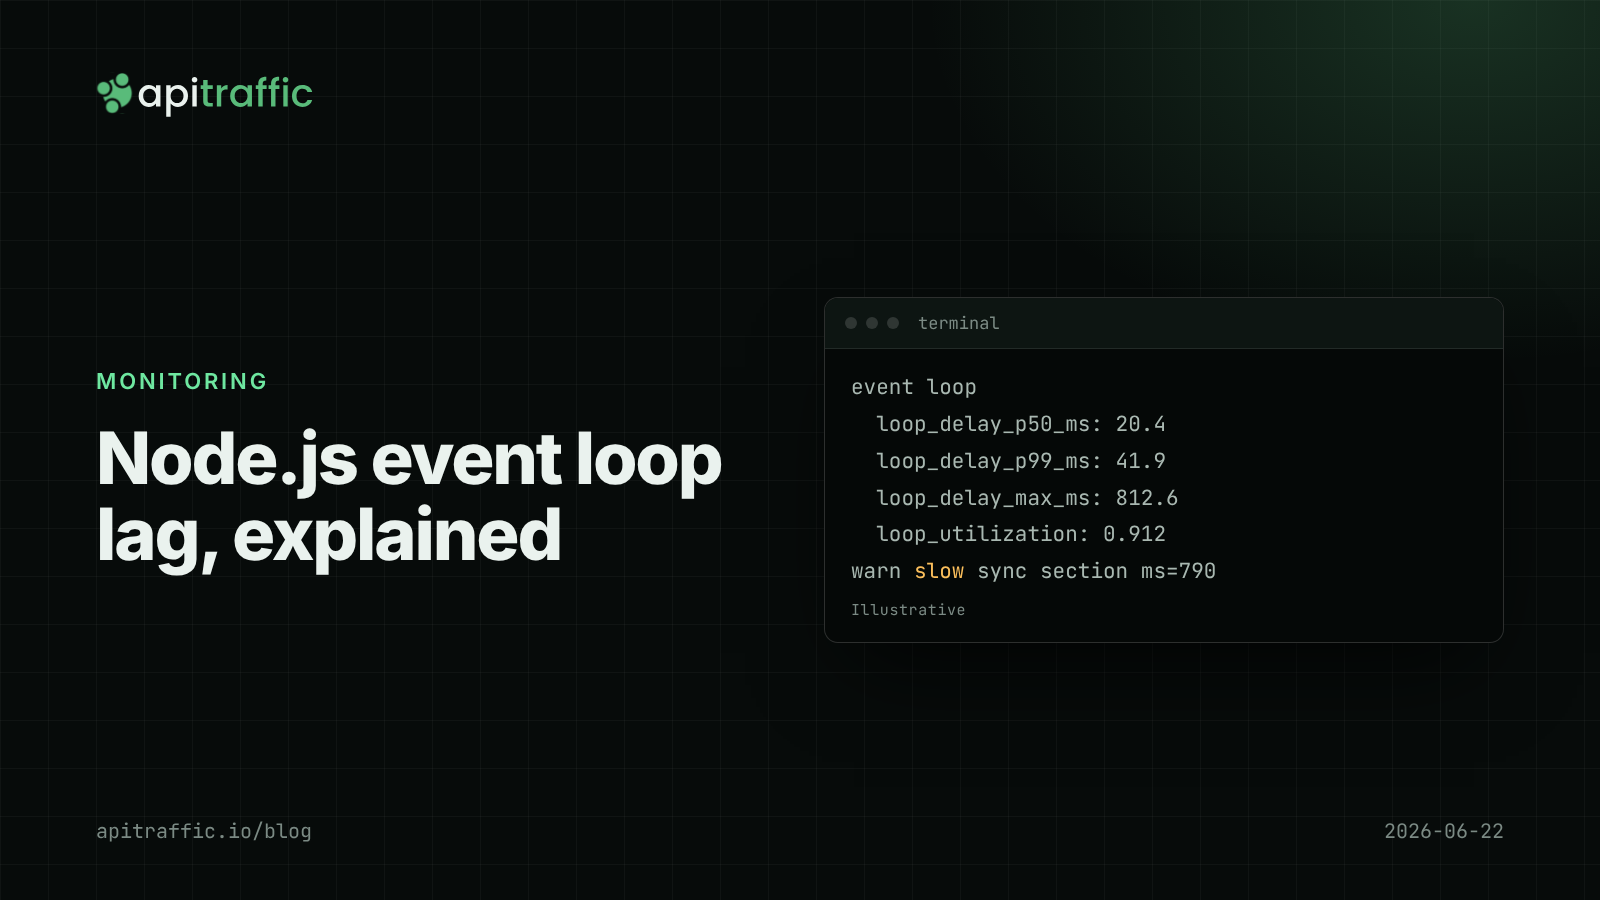
Node.js event loop lag: the metric that explains "random" slowness
Every endpoint slow at once, database fine, CPU looks idle: that is event loop lag. Here is how to measure it in Node with built-in tools and find the code that blocks.

Third-party API latency: measuring vendor slowness and failures in Node
The vendor status page is green and your checkout is slow. Here is how to measure third-party API latency and failures from your own Node servers, per dependency, without wrapping fetch.
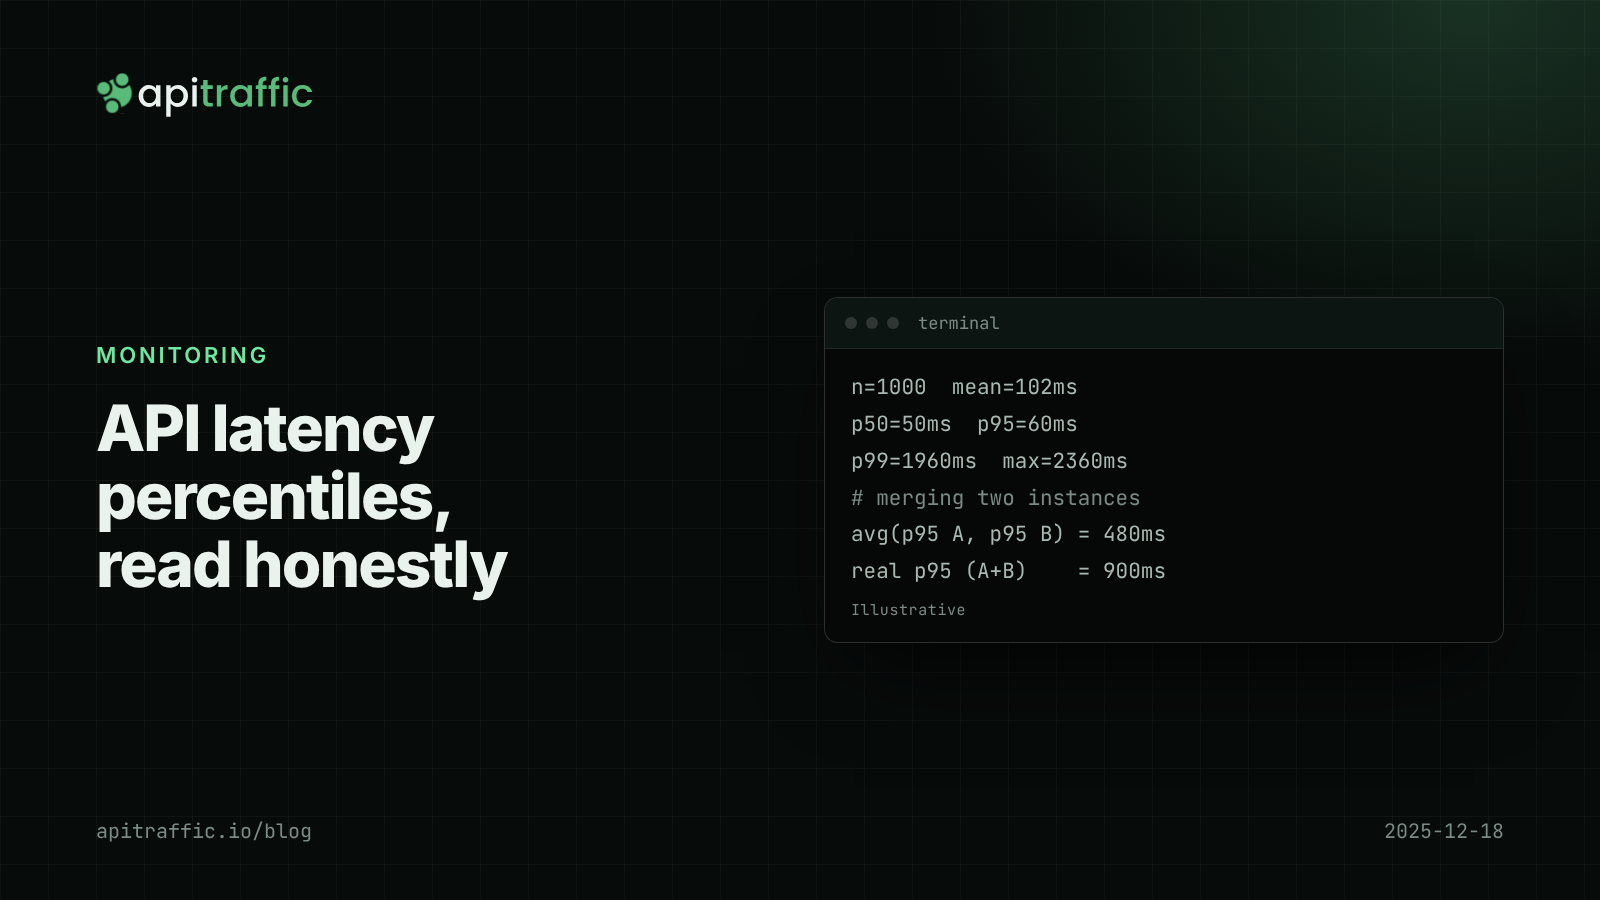
API latency percentiles: how to read p50, p95 and p99 without fooling yourself
Your average latency says 102 ms; a customer says the app hangs for two seconds. Both are true. Learn to read p50, p95 and p99, avoid the four classic mistakes, and record percentiles per route in Node.