
Fastify logging: getting the most from the built-in pino logger
A production config for Fastify's pino logger: redaction, request ids, per-route levels and safe body logging.
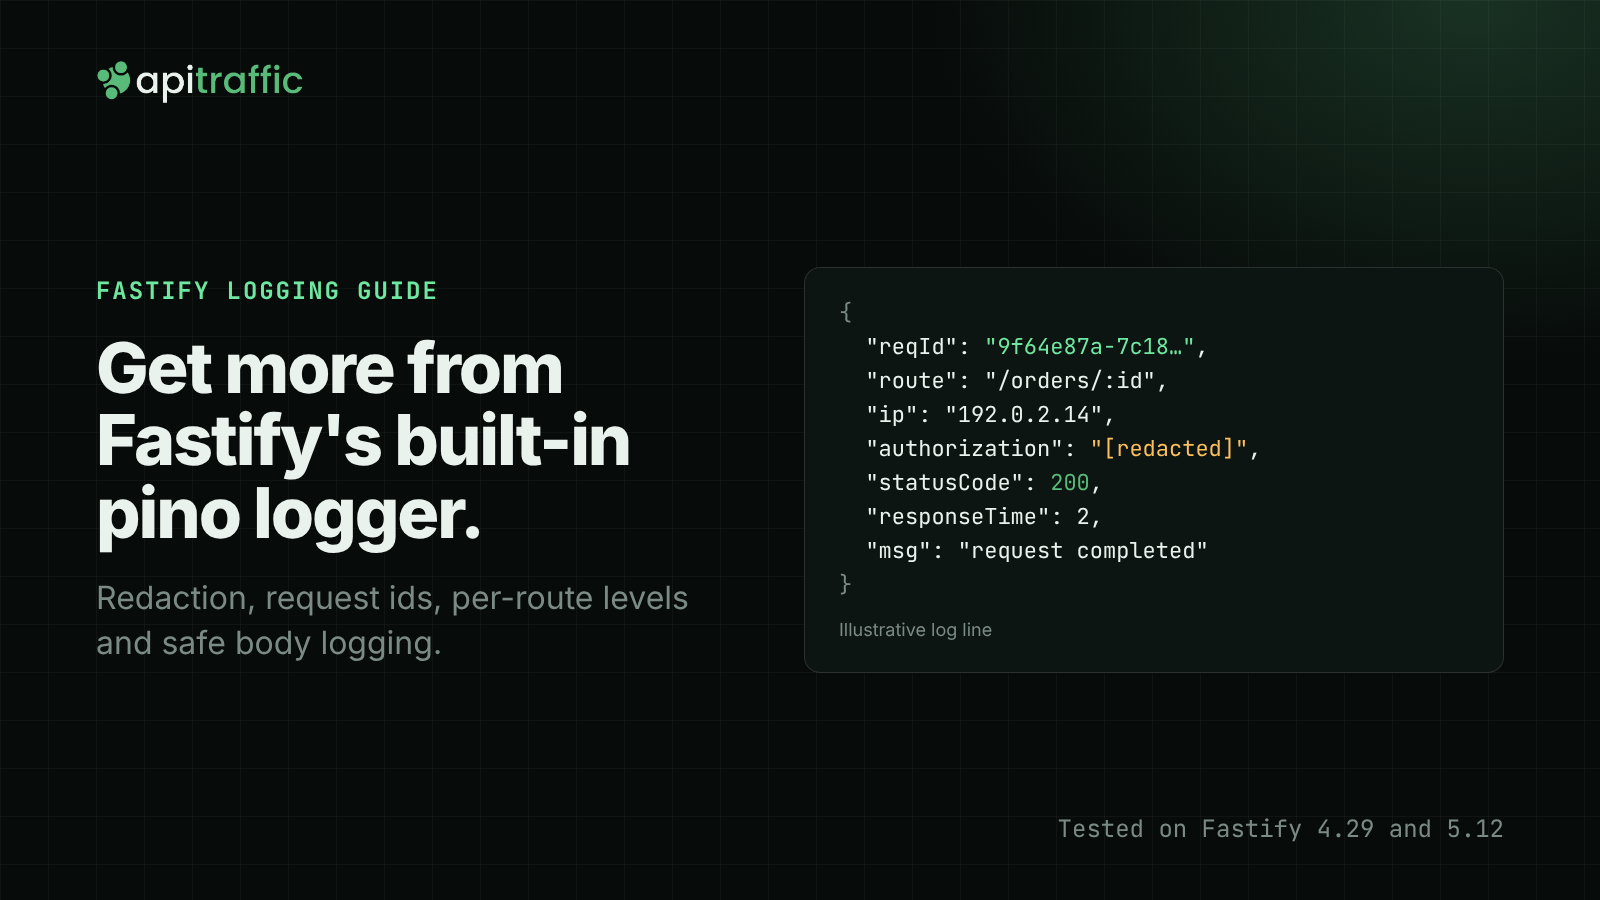
Fastify logging is built in: pass logger: true and every request gets two JSON log lines from pino, tagged with a request id. For production you want more than that default, though. Set a log level from the environment, redact credentials, add the matched route and user agent with a serializer, accept a client’s request id only after validating it, silence health checks per route, and log request and response bodies selectively from hooks. Every snippet below was run on Fastify 5.12.8 (pino 10.4.0) and Fastify 4.29.1 (pino 9.14.0) on Node 22; the one 5.10+ feature is marked.
This is the Fastify chapter of our Node.js API logging guide. If you are new to pino itself, start with pino logging in Node.js.
What the default Fastify logger gives you
const fastify = require('fastify')({ logger: true })

fastify.get('/orders/:id', async (request) => {
  return { id: request.params.id, status: 'shipped' }
})

fastify.listen({ port: 3000 })
One request to /orders/42 on Fastify 5 produced:
{"level":30,"time":1794521863752,"pid":420,"hostname":"vm","reqId":"req-1","req":{"method":"GET","url":"/orders/42","host":"127.0.0.1:3000","remoteAddress":"127.0.0.1","remotePort":35092},"msg":"incoming request"}
{"level":30,"time":1794521863755,"pid":420,"hostname":"vm","reqId":"req-1","res":{"statusCode":200},"responseTime":2.2883759999999995,"msg":"request completed"}
That leaves out most of what you need when debugging an incident:
- The route pattern.
urlis/orders/42, so you can’t group by endpoint without parsing paths. - The user agent and any client identifier.
- A useful request id.
req-1restarts at 1 on every process restart and every instance, so it collides across a fleet. - Bodies. Fastify never logs request or response bodies by default, which is the right default.
On Fastify 4 the request object logs hostname instead of host; everything else matches.
Errors are already handled for you. A thrown error that ends in a 5xx is logged at error level with the serialized err (type, message, stack), and 4xx errors from the default error handler are logged at info. You don’t need a catch-all log.error in every handler.
Fastify logger options for production
All of this goes in the logger object, which Fastify passes to pino:
const { randomUUID } = require('node:crypto')
const Fastify = require('fastify')

const fastify = Fastify({
  logger: {
    level: process.env.LOG_LEVEL || 'info',
    redact: {
      paths: [
        'req.headers.authorization',
        'req.headers.cookie',
        'body.password',
        'body.card.number',
      ],
      censor: '[redacted]',
    },
    serializers: {
      req (request) {
        return {
          method: request.method,
          url: request.url,
          route: request.routeOptions.url,
          ip: request.ip,
          headers: {
            'user-agent': request.headers['user-agent'],
            authorization: request.headers.authorization,
          },
        }
      },
      res (reply) {
        return { statusCode: reply.statusCode }
      },
    },
  },
  // Read the incoming id ourselves so a client can't put 10 KB of junk in every log line
  requestIdHeader: false,
  genReqId (req) {
    const incoming = req.headers['x-request-id']
    return typeof incoming === 'string' && /^[\w-]{1,64}$/.test(incoming)
      ? incoming
      : randomUUID()
  },
  trustProxy: true,
})

// Send the id back so clients can quote it in bug reports
fastify.addHook('onSend', async (request, reply) => {
  reply.header('x-request-id', request.id)
})
A request with a bearer token now logs like this:
{"level":30,"reqId":"9f64e87a-7c18-4b64-93f9-85ff8f639660","req":{"method":"GET","url":"/orders/42","route":"/orders/:id","ip":"127.0.0.1","headers":{"user-agent":"curl/8.7.1","authorization":"[redacted]"}},"msg":"incoming request"}
(pid, hostname and time trimmed for width.)
level
Read it from the environment so you can turn on debug without a deploy. Our post on Node.js log levels covers which level to use for what.
redact
Pino’s redaction runs on the object being logged, and the paths are relative to that object. req.headers.authorization only matches because the serializer outputs req.headers. Paths that don’t exist cost nothing, and when a listed key exists but is undefined (no Authorization header was sent), pino still prints the censor. That’s a little noisy, but it means the field is always masked. It is safer still to leave headers you don’t need out of the serializer, so they never reach the redactor. More patterns are in how to redact sensitive data from logs.
serializers
The req serializer controls what “incoming request” contains. request.routeOptions.url gives the route pattern (/orders/:id), which is what you want to group and alert on. request.ip respects trustProxy, so behind a load balancer you get the client address instead of the balancer’s. Only set trustProxy: true when a proxy you control sits in front, or clients can spoof X-Forwarded-For.
requestIdHeader and genReqId
Fastify 4 and 5 differ here. In Fastify 4 the default requestIdHeader is 'request-id', so any client can set your log ids by sending that header. In Fastify 5 it defaults to false and every id comes from genReqId. Either way, if you want to honour an upstream id (from a gateway, or a client retrying a checkout), validate it. With the code above, a request carrying x-request-id: checkout-7f3a logs "reqId":"checkout-7f3a", and one carrying a 500-character id gets a fresh UUID. To keep that id on log lines written outside the request object, see request ids with AsyncLocalStorage.
Custom logger instance
In Fastify 4 you could pass an existing pino instance as logger. Fastify 5 throws FST_ERR_LOG_INVALID_LOGGER_CONFIG for that; pass it as loggerInstance instead, per the v5 migration guide.
Per-route log levels and child loggers
Every route accepts a logLevel, which overrides the server level for that route only:
// A probe every 10 seconds is 8,640 requests a day per instance, two log lines each
fastify.get('/health', { logLevel: 'silent' }, async () => ({ ok: true }))

// Turn one noisy route up to debug while you chase a bug, without touching the rest
fastify.register(async function payments (app) {
  app.post('/charge', { logLevel: 'debug' }, async (request) => {
    request.log.debug({ body: request.body }, 'charge payload')
    return { charged: true }
  })
}, { prefix: '/payments' })
With the server at info, /health wrote nothing at all, and /payments/charge wrote its debug line (with password and card.number redacted). You can also set logLevel in the options of register() to cover a whole plugin.
request.log is already a child logger bound to the request id. Make your own child when a helper should stamp every line with its own context:
async function loadCart (log, cartId) {
  const cartLog = log.child({ cartId })
  cartLog.info('loading cart')
  cartLog.warn({ items: 0 }, 'cart is empty')
}

fastify.get('/cart/:id', async (request) => {
  await loadCart(request.log, request.params.id)
  return { items: [] }
})
Both lines carry reqId and cartId. Pass request.log down instead of importing a global logger, or your helper’s lines lose the request id.
Fastify request logging: one line per request (Fastify 5.10+)
Two lines per request (“incoming request” and “request completed”) doubles your log volume, and the first line rarely helps: if the request finished, the second line has everything. Fastify 5.10.0 added a LogController class (the v5.10.0 release) that lets you replace the built-in lines. The top-level disableRequestLogging and requestIdLogLabel options now print a deprecation warning and are slated for removal in Fastify 6.
const Fastify = require('fastify')
const { LogController } = Fastify

class ApiLogController extends LogController {
  constructor () {
    super({
      // No per-request lines for probes and metrics scrapes
      disableRequestLogging: (req) => req.url === '/health' || req.url === '/metrics',
    })
  }

  // One line per request instead of two
  incomingRequest () {}

  requestCompleted (error, request, reply) {
    // Overrides skip the built-in check, so call it yourself
    if (this.isLogDisabled(request)) return
    const line = {
      method: request.method,
      route: request.routeOptions.url,
      statusCode: reply.statusCode,
      responseTime: Math.round(reply.elapsedTime),
    }
    if (error || reply.statusCode >= 500) reply.log.error({ ...line, err: error }, 'request failed')
    else if (reply.statusCode >= 400) reply.log.warn(line, 'request rejected')
    else reply.log.info(line, 'request completed')
  }
}

const fastify = Fastify({ logger: true, logController: new ApiLogController() })
When you override requestCompleted, Fastify no longer consults the disableRequestLogging function. Our first version logged /health anyway until we added the isLogDisabled() check. Output for a 200 and a 404:
{"level":30,"reqId":"req-2","method":"GET","route":"/orders/:id","statusCode":200,"responseTime":0,"msg":"request completed"}
{"level":40,"reqId":"req-3","method":"GET","route":"/orders/:id","statusCode":404,"responseTime":0,"msg":"request rejected"}
Logging 4xx at warn makes a burst of 401s or 404s (a credential-stuffing run, a scanner walking paths) easy to filter. On Fastify 4, the closest equivalent is disableRequestLogging: true plus your own onResponse hook; our post on Fastify hooks for logging and auth shows that pattern.
Fastify: log request body and response body safely
Bodies are where the useful detail is (which field failed validation, what the error response said) and also where the passwords and card numbers are. Log them on purpose, per route, with redaction on:
const fastify = require('fastify')({
  logger: {
    redact: {
      paths: ['body.password', 'body.token', 'body.*.cardNumber'],
      censor: '[redacted]',
    },
  },
})

const MAX_LOGGED_BYTES = 2048

// Request bodies: parsed and validated by the time preHandler runs
fastify.addHook('preHandler', async (request) => {
  if (request.body && request.routeOptions.config.logBody) {
    request.log.info({ body: request.body }, 'request body')
  }
})

// Response bodies: onSend gets the serialized payload (usually a string)
fastify.addHook('onSend', async (request, reply, payload) => {
  if (reply.statusCode >= 400 && typeof payload === 'string') {
    request.log.warn(
      { statusCode: reply.statusCode, responseBody: payload.slice(0, MAX_LOGGED_BYTES) },
      'error response body'
    )
  }
  return payload
})

fastify.post('/signup', { config: { logBody: true } }, async (request, reply) => {
  if (!request.body.email.includes('@')) {
    return reply.code(422).send({ error: 'invalid_email', field: 'email' })
  }
  return { ok: true }
})
A bad signup produced:
{"level":30,"reqId":"req-1","body":{"email":"not-an-email","password":"[redacted]"},"msg":"request body"}
{"level":40,"reqId":"req-1","statusCode":422,"responseBody":"{\"error\":\"invalid_email\",\"field\":\"email\"}","msg":"error response body"}
How the hooks were chosen:
preHandlerruns after body parsing and schema validation, sorequest.bodyis the parsed object and redaction paths apply to it. Logging inonRequestis too early: there is no body yet.onSendreceives the serialized payload, usually a string. Redaction can’t reach inside a string, so only log responses you know are safe (error bodies here), and cap the size. If you register@fastify/compress, itsonSendhook may run first and hand you a stream or a buffer, which thetypeofcheck skips.- The opt-in
config.logBodyflag keeps bodies out of routes that handle files, tokens or personal data.
In the same test, Fastify’s default error handler sent "message":"db pool exhausted" to the client on a thrown 500. If your error messages contain internals, add a setErrorHandler that logs the error and returns a generic body.
Disabling logs for noisy routes
You now have three ways to quiet a route, from smallest to largest scope:
| Method | Works on | Effect |
|---|---|---|
logLevel: 'silent' on the route |
Fastify 4 and 5 | No log lines from that route at all, including your own request.log calls |
logLevel on register() options |
Fastify 4 and 5 | Same, for every route in a plugin |
LogController with a disableRequestLogging function |
Fastify 5.10+ | Drops only the built-in request lines; your own request.log lines still print |
Use the first for health checks and readiness probes. Use the third when a route is busy but you still want its warnings, such as a webhook receiver.
Transports in production
In production, write plain JSON to stdout and let your platform (Docker, Kubernetes, Render, Fly, ECS) collect it. Pretty printing belongs in development:
const isDev = process.env.NODE_ENV !== 'production'

const fastify = require('fastify')({
  logger: isDev
    ? { level: 'debug', transport: { target: 'pino-pretty', options: { translateTime: 'HH:MM:ss', ignore: 'pid,hostname' } } }
    : { level: 'info' }, // production: plain JSON to stdout, let the platform ship it
})
When you need to send logs somewhere directly, use pino transports. They run in a worker thread, so formatting and network calls stay off your event loop. Each target can have its own level:
const fastify = require('fastify')({
  logger: {
    level: 'info',
    transport: {
      targets: [
        // JSON to stdout for the platform's log collector
        { target: 'pino/file', level: 'info', options: { destination: 1 } },
        // warn and above also go to a file (or swap in a vendor transport here)
        { target: 'pino/file', level: 'warn', options: { destination: './logs/warn.log', mkdir: true } },
      ],
    },
  },
})
In our run, stdout got every line and logs/warn.log got only the warn line. How long to keep what you ship is a separate decision; see API log retention.
Where those logs can go:
| Option | Package | Good at |
|---|---|---|
| stdout plus your platform’s collector | none (pino/file, destination 1) |
Zero dependencies; works with any log pipeline |
| Grafana Loki | pino-loki |
Self-hosted, label-based queries, pairs with Grafana dashboards |
| Elasticsearch / OpenSearch | pino-elasticsearch |
Full-text search over large volumes you host yourself |
| Better Stack | @logtail/pino |
Hosted search and alerting with a small setup |
| Axiom | @axiomhq/pino |
Hosted storage and querying for high-volume event data |
| Datadog | pino-datadog-transport, or the Datadog Agent reading stdout |
Logs alongside Datadog APM traces and metrics |
| OpenTelemetry | @opentelemetry/instrumentation-pino |
Adds trace and span ids to pino lines so logs join up with traces in any OTel backend |
| ApiTraffic | @apitraffic/node |
Full request and response records per call, without writing log lines for them |
Every package above is on npm; check its own docs for current setup. Pick the one that sits where the rest of your telemetry already lives.
Doing this with ApiTraffic
Most of the work in this post is getting request and response details into logs without leaking secrets. ApiTraffic records that per request instead: register the plugin first and every request is captured with headers, bodies, status, timing and the matched route, plus outbound calls your app makes with fetch, http or axios (Fastify setup docs).
const fastify = require('fastify')({ logger: true })
const apitraffic = require('@apitraffic/node')

fastify.register(apitraffic.fastify())
It supports Fastify 4 and 5 on Node 20 or later. Redaction rules are set in the dashboard and pushed to running servers, and the SDK sends nothing until those rules have loaded. Your pino logs stay for application events; the request records live in a searchable log. Register it before @fastify/compress so it sees the uncompressed response. See what’s hitting your API: apitraffic.io
For metrics, latency and alerting on the same app, read Fastify monitoring and the broader Node.js API monitoring guide.
FAQ
How do I enable logging in Fastify?
Pass logger: true to the Fastify factory, or a pino options object such as { level: 'info' }. Fastify then logs every request and response as JSON, and you can write your own lines with request.log inside handlers or fastify.log elsewhere.
How do I log the request body in Fastify?
Log it from a preHandler hook, where request.body is already parsed and validated: request.log.info({ body: request.body }, 'request body'). Add redact paths for passwords and tokens, and only log bodies on routes that opt in, through config in the route options.
How do I use a custom pino logger with Fastify 5?
Create the pino instance yourself and pass it as loggerInstance. Passing an instance as logger worked in Fastify 4, but Fastify 5 throws FST_ERR_LOG_INVALID_LOGGER_CONFIG because logger now only accepts an options object.
How do I stop Fastify from logging health check requests?
Add logLevel: 'silent' to the health route’s options. On Fastify 5.10 and later you can instead use a LogController with a disableRequestLogging function, which drops only the built-in request lines for matching URLs.
Does Fastify log errors automatically?
Yes. When a handler throws or rejects and the default error handler sends a 5xx, Fastify logs the error at error level with its stack. Errors that end in a 4xx are logged at info. If you set your own setErrorHandler, log the error there yourself.
Keep reading
Pino logging in Node.js: a practical structured logging setup for Express and Fastify
A customer says invoices failed yesterday and your logs are a wall of console.log. Set up Pino logging for Express or Fastify in an afternoon: JSON lines, request IDs, levels by status, redaction and a team checklist.
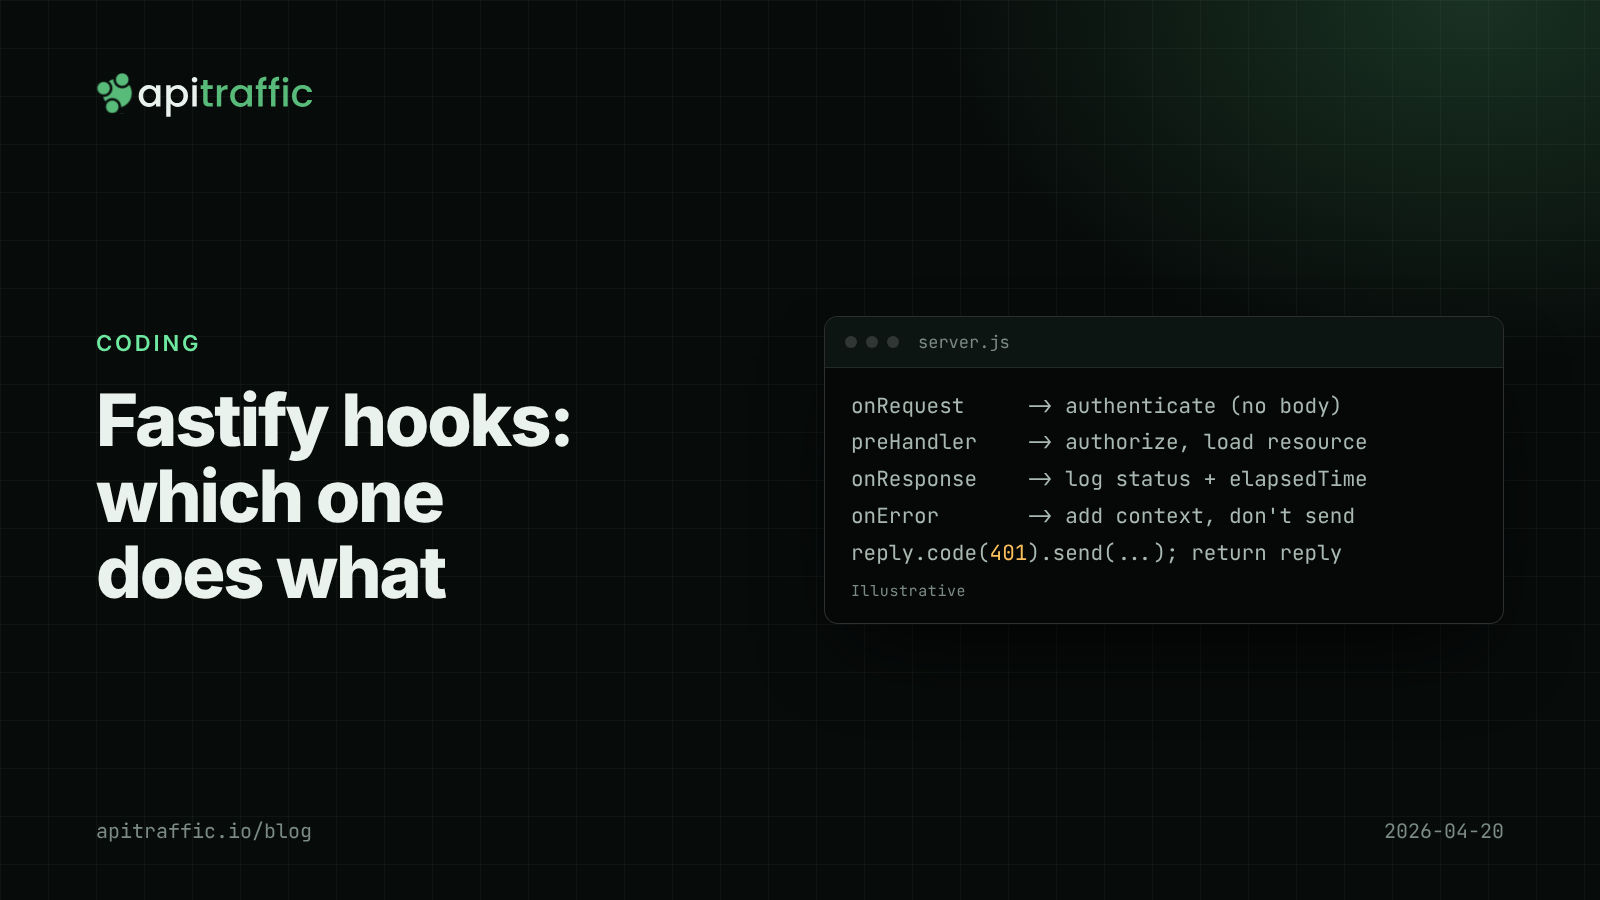
Fastify hooks for logging and auth: onRequest, preHandler and onResponse explained
Auth checks that run before the body exists, log lines missing the status code, handlers that run after a 401: most come from using the wrong Fastify hook. Here is which hook does which job in Fastify v5, with working code.
AsyncLocalStorage request IDs: follow one request through a Node.js API
A customer says checkout failed at 2pm and your logs are fifty requests interleaved. Add request IDs with AsyncLocalStorage in Express or Fastify in an afternoon, and every log line, response and downstream call carries the same ID.