
Express logging in production: pino-http vs morgan, request bodies and redaction
Pick a logger, add request IDs and route patterns, log bodies for failed requests only, and redact secrets.
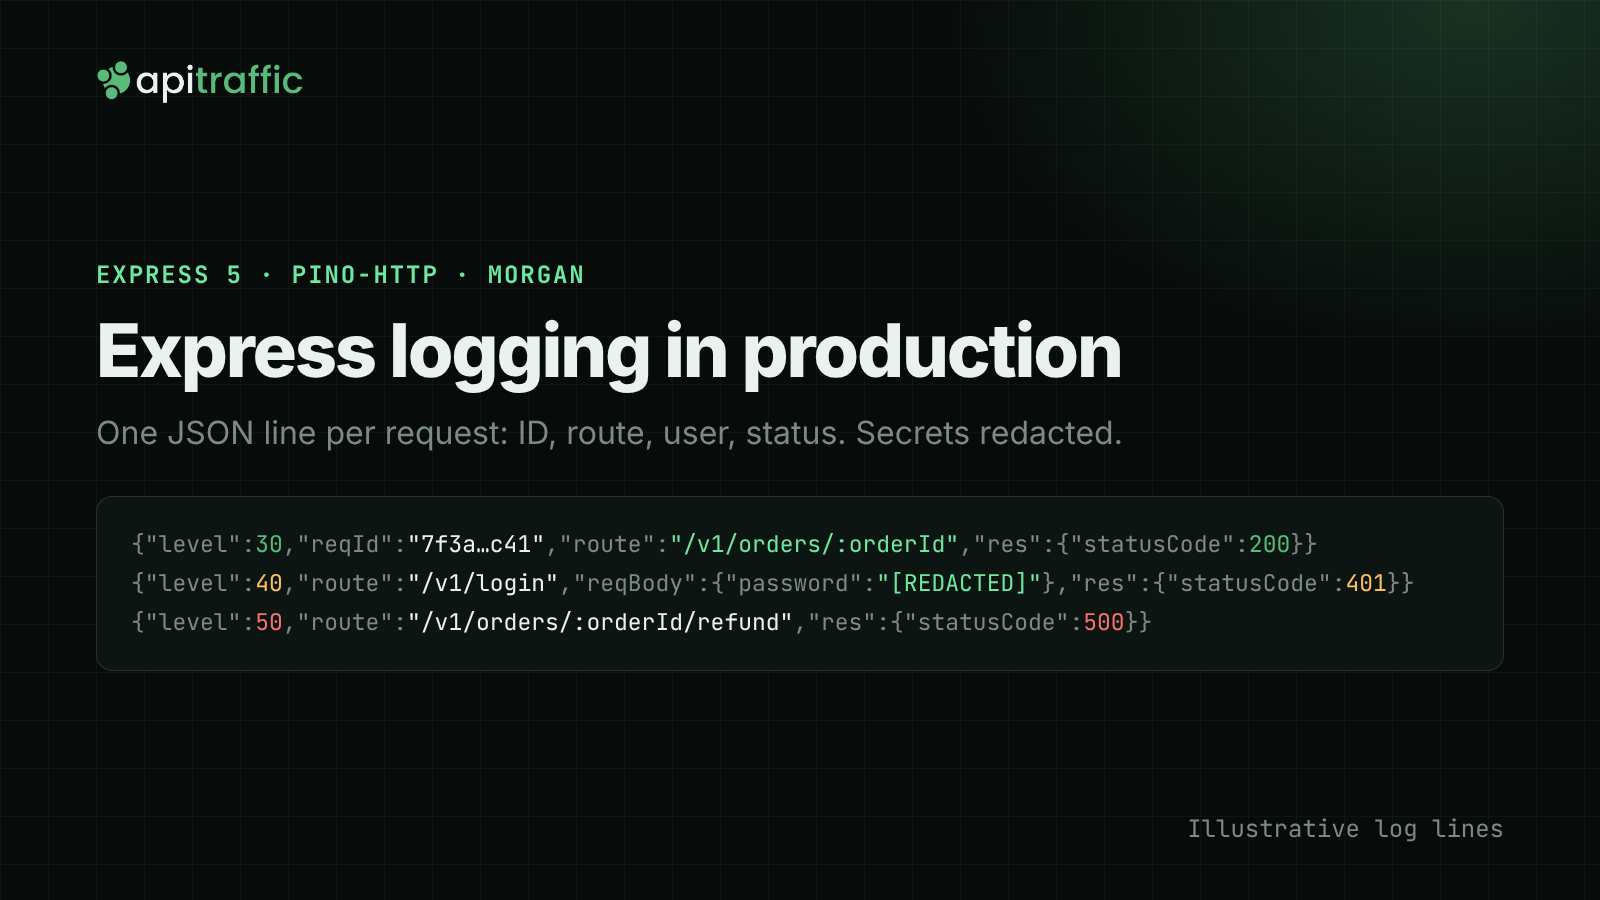
For Express logging in production, use pino-http to write one JSON line per request to stdout, with a request ID, the route pattern, status, duration and the user, and with credentials redacted before the line is written. Keep morgan for local development if you like its one-line format. Everything below was run on Express 5.3.0, pino 10.4.0, pino-http 11.0.0, morgan 1.12.1, winston 3.19.0 and express-winston 4.2.0 on Node.js 22, and the log lines are the real output.
This guide covers picking a logger, a full pino-http setup for Express 5, logging request and response bodies without logging everything, redaction, wiring errors into the same line, and where the logs go afterwards. For the framework-agnostic version, see the Node.js API logging guide.
morgan vs pino vs winston for Express request logging
All three are maintained and widely used. What differs is what a log line looks like and what you get besides it.
| Option | What it writes | Good at | Watch out for |
|---|---|---|---|
| morgan | One text line per request in Apache style (combined, common, dev, tiny), or whatever a format function returns |
Zero setup, readable in a terminal, maintained by the Express project | No logger for your own messages; JSON and request IDs are up to you |
| pino-http | One JSON object per request, plus req.log, a child logger bound to that request |
Low overhead, request IDs, redaction and serializers built in | Raw JSON is hard to read locally without pino-pretty |
| winston + express-winston | Whatever format you configure, sent to one or more transports | Many transports and formats, familiar to teams already on winston | More configuration; request IDs and redaction are your job |
| A hosted log platform | Your stdout, collected by an agent or the platform | Search, retention and alerting across services | Cost grows with volume; it only stores what your app writes |
| An API observability tool | Captured requests and responses, from an SDK in the app | Full request and response detail without extra logging code | Another dependency in the request path |
Here is the same request through each of the three libraries. morgan with the combined format:
127.0.0.1 - - [12/Nov/2026:22:18:27 +0000] "GET /v1/orders/ord_123 HTTP/1.1" 200 11 "-" "curl/8.7.1"
morgan with a format function that returns JSON:
{"id":"0ea09f53-d589-4cf4-8485-2e9112cf8195","method":"GET","url":"/v1/orders/ord_123","status":200,"ms":1.443}
express-winston with winston.format.json():
{"level":"info","message":"HTTP GET /v1/orders/ord_123","meta":{"req":{"httpVersion":"1.1","method":"GET","originalUrl":"/v1/orders/ord_123","url":"/v1/orders/ord_123"},"res":{"statusCode":200},"responseTime":1}}
The combined line is easy to read and hard to query. You can’t filter it by user or group it by route without regex, and there’s no ID to connect it to the error your handler logged two lines later. You can build JSON and IDs on top of morgan (the second example does), but you end up rebuilding what pino-http ships with.
If the app already uses winston, add express-winston and set it up as below. Otherwise use pino-http. The pino-http README publishes its own benchmarks if overhead matters to you; run your own load test before relying on them.
Express logging middleware with pino-http, step by step
Install the two packages:
npm install pino pino-http
Put the logger in its own module. This is the whole file we ran:
// logger.js
const { randomUUID } = require('node:crypto');
const pino = require('pino');
const pinoHttp = require('pino-http');

// Route pattern such as /v1/orders/:orderId, never the raw URL.
function routeOf(req, res) {
  if (!req.route) return undefined;
  const mount = res.locals.mountPath ?? req.baseUrl;
  return (mount + req.route.path).replace(/(.)\/$/, '$1');
}

// Mount on each router: Express resets req.baseUrl before app-level error handlers run.
function trackMount(req, res, next) {
  res.locals.mountPath = req.baseUrl;
  next();
}

const logger = pino({
  level: process.env.LOG_LEVEL ?? 'info',
  redact: {
    paths: [
      'req.headers.authorization',
      'req.headers.cookie',
      'req.headers["x-api-key"]',
      'reqBody.password',
      'reqBody.*.password',
      'reqBody.token',
    ],
    censor: '[REDACTED]',
  },
});

const httpLogger = pinoHttp({
  logger,
  genReqId(req, res) {
    const incoming = req.headers['x-request-id'];
    const id = typeof incoming === 'string' && /^[\w-]{8,64}$/.test(incoming)
      ? incoming
      : randomUUID();
    res.setHeader('x-request-id', id);
    return id;
  },
  customLogLevel(req, res, err) {
    if (err || res.statusCode >= 500) return 'error';
    if (res.statusCode >= 400) return 'warn';
    return 'info';
  },
  customProps(req, res) {
    const props = {
      route: routeOf(req, res),
      userId: req.user?.id,
    };
    // Bodies only for failed requests, and only once a response exists.
    if (res.headersSent && res.statusCode >= 400) {
      props.reqBody = req.body;
      props.resBody = res.locals.resBody;
    }
    return props;
  },
  serializers: {
    req(req) {
      return { id: req.id, method: req.method, url: req.url, headers: req.headers };
    },
    res(res) {
      return { statusCode: res.statusCode };
    },
  },
});

module.exports = { logger, httpLogger, trackMount };
What each option does:
genReqIdreuses anx-request-idfrom your load balancer or gateway when it looks like an ID, makes a UUID otherwise, and sends it back in the response header. Validate the incoming value: it’s client input, and it ends up in every log line. The ID is also onreq.id, so your error responses can include it. If you need the ID deeper in the call stack thanreqreaches, AsyncLocalStorage request IDs covers that.customLogLevelmakes 4xx awarnand 5xx anerror, so you can filter by level instead of parsing status codes. Our post on Node.js log levels goes through what belongs at each one.customPropsadds fields to the request’s log line. pino-http calls it when the request starts and again when it finishes, so values that only exist later (the matched route, the authenticated user) show up on the completion line.serializersdecide whatreqandreslook like in the log. The default request serializer also includes the query, route params and the client’s remote address and port; this one keeps the ID, method, URL and headers.
Then wire it into the app. Order matters:
// app.js
const express = require('express');
const { httpLogger, trackMount } = require('./logger');
const { captureResponseBody } = require('./capture');

const app = express();
app.get('/healthz', (req, res) => res.send('ok')); // above the logger: never logged

app.use(httpLogger);
app.use(express.json({ limit: '100kb' }));
app.use(captureResponseBody);
app.use((req, res, next) => { req.user = { id: 'u_42' }; next(); }); // stand-in for auth

const orders = express.Router();
orders.use(trackMount);
orders.get('/:orderId', (req, res) => {
  req.log.info({ orderId: req.params.orderId }, 'loading order');
  res.json({ id: req.params.orderId, status: 'paid' });
});
app.use('/v1/orders', orders);
The health check sits above the logger so load balancer probes don’t fill your logs. pino-http also has an autoLogging.ignore option if you’d rather keep everything behind one middleware.
A request with an Authorization header and an x-request-id from the gateway produced these two lines (pretty-printed here; in the terminal each is one line):
{"level":30,"time":1794521859845,"pid":356,"hostname":"vm",
 "req":{"id":"req-from-gateway-01","method":"GET","url":"/v1/orders/ord_123",
  "headers":{"host":"localhost:3000","authorization":"[REDACTED]","x-request-id":"req-from-gateway-01","user-agent":"node"}},
 "orderId":"ord_123","msg":"loading order"}
{"level":30,"time":1794521859846,"pid":356,"hostname":"vm",
 "req":{"id":"req-from-gateway-01","method":"GET","url":"/v1/orders/ord_123",
  "headers":{"host":"localhost:3000","authorization":"[REDACTED]","x-request-id":"req-from-gateway-01","user-agent":"node"}},
 "route":"/v1/orders/:orderId","userId":"u_42","res":{"statusCode":200},"responseTime":2,"msg":"request completed"}
(We trimmed a few headers from the output to fit.) Both lines carry req.id, so a search for req-from-gateway-01 returns everything that request logged. The loading order line has no route or userId: req.log was bound when the request arrived, before routing and auth ran. The ID is what joins them.
Why the route needs the extra helper
Log the route pattern, not only the URL. /v1/orders/ord_123 and /v1/orders/ord_124 are one endpoint, and you want one row for it when you group by route.
Express gives you req.baseUrl plus req.route.path, and two things go wrong when you combine them. Our first run logged /v1/orders/ for router.post('/'), so routeOf trims the trailing slash. The second problem is less obvious: when a route throws, the error reaches the app-level error middleware after Express has left the router and reset req.baseUrl. Before we added trackMount, the failing request below was logged with "route":"/:orderId/refund", missing its /v1/orders prefix. trackMount records the mount path while the request is still inside the router. Add router.use(trackMount) to each router you mount.
Logging request and response bodies in Express
You can log request bodies with a single line: req.body is there once express.json() has run. Response bodies are harder, because Express doesn’t keep what you sent. res.json() serializes the value and writes it, and a body piped from a stream or written in chunks with res.write() never exists as one value at all.
Two rules keep body logging useful without turning your logs into a copy of your database:
- Log bodies only for failed requests. A 422 with the payload that caused it is worth the bytes. A successful product listing is not.
- Cap the size.
express.json({ limit: '100kb' })already caps request bodies (100kb is also the body-parser default). Cap the response side yourself.
This middleware keeps the value passed to res.json() on res.locals, up to a limit:
// capture.js
const MAX_BODY_CHARS = 4096;

function captureResponseBody(req, res, next) {
  const json = res.json.bind(res);
  res.json = (body) => {
    const text = JSON.stringify(body) ?? '';
    res.locals.resBody = text.length <= MAX_BODY_CHARS
      ? body
      : `[truncated: ${text.length} chars]`;
    return json(body);
  };
  next();
}

module.exports = { captureResponseBody };
It catches res.json() and res.send() with an object, since Express sends objects through res.json(). It doesn’t see streams, files or res.write(), and that’s fine for a JSON API’s error responses. It does serialize each JSON response one extra time to measure it. If that shows up in a profile, only wrap res.json on routes you care about.
customProps in logger.js adds reqBody and resBody only when the status is 400 or higher. A POST with a missing field logged this (from here on, the examples leave out time, pid, hostname and the headers):
{"level":40,"req":{"id":"dfbb5c0c-04ec-4ba8-9210-135e8755e836","method":"POST","url":"/v1/orders"},
 "route":"/v1/orders","userId":"u_42",
 "reqBody":{"qty":2},"resBody":{"error":{"code":"missing_sku"}},
 "res":{"statusCode":422},"responseTime":6,"msg":"request completed"}
The line has enough to see what the client sent and what the API answered, without reproducing the request.
Redaction: what never goes in an Express access log
The pino redact option replaces values at given paths before the line is serialized. A failed login with a password in the body logged:
{"level":40,"req":{"id":"317b165d-f273-4b6a-bf49-1f422f4257ac","method":"POST","url":"/v1/login"},
 "route":"/v1/login","reqBody":{"email":"[email protected]","password":"[REDACTED]"},
 "resBody":{"error":{"code":"bad_credentials"}},"res":{"statusCode":401},"msg":"request completed"}
Things to know about pino redaction:
- Paths are case sensitive. Node lowercases incoming header names, so
req.headers.authorizationis safe, butreqBody.passworddoesn’t match a body field namedPassword. - A
*wildcard matches one level. We ranreqBody.passwordandreqBody.*.passwordagainst a body with passwords at three depths: the first two were redacted and{"data":{"user":{"password":"c"}}}went through in plain text. - Wildcards cost more than explicit paths. The pino docs measured about 50% overhead in one wildcard case against about 2% for plain paths, so list the paths you know.
Never log Authorization, Cookie, Set-Cookie or API key headers, or passwords, tokens and one-time codes in bodies. Also look at what’s left: the line above still has an email address. Whether that’s acceptable is a question for your privacy policy. Query strings can carry tokens too, and req.url includes them. Our longer post on redacting sensitive data in logs covers deny lists versus allow lists and how to test redaction in CI.
Errors: one line with the request ID
The usual setup logs a 500 twice: once in the error middleware with the stack, and once as “request completed” with the status. pino-http can put both on one line. If the error middleware sets res.err, the completion line includes the serialized error and the message becomes request errored:
orders.post('/:orderId/refund', async (req, res) => {
  throw new Error('payment provider timeout');
});

app.use((err, req, res, next) => {
  if (res.headersSent) return next(err);
  res.err = err; // pino-http logs it on the completion line
  res.status(err.status ?? 500).json({
    error: { code: 'internal_error', requestId: req.id },
  });
});
On Express 5 the rejected async handler reaches this middleware with no wrapper. The log line (stack trimmed):
{"level":50,"req":{"id":"730ad18a-f4dc-4c99-a556-e45c10d8463b","method":"POST","url":"/v1/orders/ord_123/refund"},
 "route":"/v1/orders/:orderId/refund","userId":"u_42",
 "resBody":{"error":{"code":"internal_error","requestId":"730ad18a-f4dc-4c99-a556-e45c10d8463b"}},
 "res":{"statusCode":500},
 "err":{"type":"Error","message":"payment provider timeout","stack":"Error: payment provider timeout\n    at …"},
 "responseTime":1,"msg":"request errored"}
The client got 500, an x-request-id: 730ad18a-… header and the same ID in the body. When a customer sends you that ID, one search finds the request, the route, the user and the stack. Mapping errors to status codes and what to show the client is its own topic: see Express error handling in production.
Shipping Express logs: stdout, then your platform
Write to stdout and let the platform collect it. Render, Railway, Fly, Heroku-style hosts, Kubernetes and Docker all capture stdout already. The pino transports docs recommend doing any log transformation or transmission in a separate thread or process, and pino’s own transports run in a worker thread when you do need to send logs somewhere directly.
For local development, pipe through pino-pretty instead of changing the app:
node server.js | npx pino-pretty
Two settings to decide on early:
- Level per environment.
LOG_LEVEL=infoin production,debuglocally. pino-http writes the request line at the levelcustomLogLevelreturns, so 4xx and 5xx lines survive even awarnsetting. - Retention. Request logs with bodies often contain personal data, even after redaction. Keep them as long as you need them for debugging and incident review, and no longer. Our post on API log retention has a starting schedule.
If you’re new to pino itself (child loggers, levels, transports), start with Pino logging in Node.js.
Doing this with ApiTraffic
The setup above records what you chose to log. Successful requests have no bodies in it, and streamed responses have none at all, so the request a customer complains about two days later is often the one you can’t see.
ApiTraffic’s Express middleware captures every request and response, including bodies, status, timing and the matched route, with router mount paths included. It supports Express 4.17+ and 5 on Node.js 20 or later:
const apitraffic = require('@apitraffic/node');

app.use(express.json());
app.use(apitraffic.express()); // after body parsers, before routes
Credential headers such as Authorization, Cookie and X-Api-Key are masked by default, and so are credential-shaped keys in JSON and form bodies and query strings (password, secret, names ending in token). You add your own redaction rules for fields like card numbers or dateOfBirth. Keep pino-http for your application logs and use ApiTraffic for the request record.
For the monitoring side (latency, error rates, alerting), see Express monitoring and the Node.js API monitoring guide.
FAQ
What is the best logging library for Express?
For most production Express apps, pino with pino-http. It writes structured JSON, generates request IDs, redacts paths and gives each request a child logger. If your codebase already uses winston, express-winston is a reasonable choice so you have one logging library.
Is morgan good enough for production?
morgan is fine for access logs you read by eye or ship as text. It doesn’t give you a logger for application messages, request IDs, levels by status or redaction, so you’d add those yourself. Many teams keep morgan’s dev format for local work and use pino-http in production.
How do I log the request body in Express?
Register express.json() (or the parser for your content type) and log req.body after it runs. Log it only for failed requests, cap the size with the parser’s limit option, and redact password and token fields before the line is written.
How do I log the response body in Express?
Express doesn’t store the response body, so wrap res.json() in a middleware and keep the value (or a truncated marker) on res.locals. Streams and res.write() aren’t caught this way; for those, log the status and size instead.
How do I add a request ID to Express logs?
Use pino-http’s genReqId to reuse a validated x-request-id header or create a UUID, and set it on the response. pino-http puts it on req.id and on every line from req.log, so one search returns the whole request.
See what’s hitting your API: apitraffic.io
Keep reading
Pino logging in Node.js: a practical structured logging setup for Express and Fastify
A customer says invoices failed yesterday and your logs are a wall of console.log. Set up Pino logging for Express or Fastify in an afternoon: JSON lines, request IDs, levels by status, redaction and a team checklist.
How to redact sensitive data in logs for Node.js APIs
Found a bearer token in your logs? Here's how to keep secrets and personal data out of Node API logs in an afternoon: Pino redaction, URL and error scrubbing, body allowlists and a test that catches leaks.
AsyncLocalStorage request IDs: follow one request through a Node.js API
A customer says checkout failed at 2pm and your logs are fifty requests interleaved. Add request IDs with AsyncLocalStorage in Express or Fastify in an afternoon, and every log line, response and downstream call carries the same ID.